Estimated Value: $194,000 - $268,000
--
Bed
--
Bath
1,508
Sq Ft
$161/Sq Ft
Est. Value
About This Home
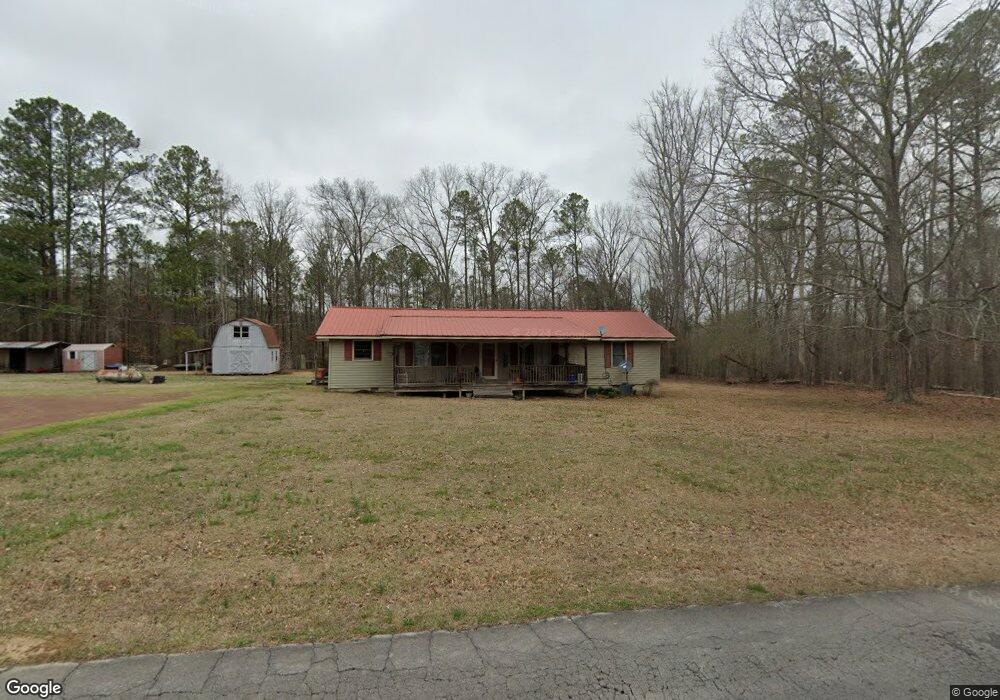
This home is located at 1388 Livingston Rd SW, Rome, GA 30161 and is currently estimated at $242,925, approximately $161 per square foot. 1388 Livingston Rd SW is a home located in Floyd County with nearby schools including Coosa Middle School and Coosa High School.
Ownership History
Date
Name
Owned For
Owner Type
Purchase Details
Closed on
Dec 23, 2021
Sold by
Lovelace Peggy A
Bought by
Sargent R Richard
Current Estimated Value
Purchase Details
Closed on
Feb 9, 2021
Sold by
Lovelace John C
Bought by
Lovelace Peggy A
Purchase Details
Closed on
Nov 1, 1984
Sold by
Womack Larry Robert and Womack Janice P
Bought by
Lovelace John C and Lovelace Peggy A
Purchase Details
Closed on
Oct 18, 1979
Sold by
Martin James Ruel and Martin Barbara
Bought by
Womack Larry Robert and Womack Janice P
Purchase Details
Closed on
Dec 1, 1968
Sold by
Gearheart Louis S
Bought by
Martin James Ruel and Martin Barbara
Purchase Details
Closed on
Jun 11, 1964
Bought by
P and R
Purchase Details
Closed on
Jun 10, 1964
Sold by
Brannon Carter S
Bought by
Gearheart Louis S
Purchase Details
Closed on
May 15, 1963
Sold by
Williams Shelor Miss
Bought by
Brannon Carter S
Purchase Details
Closed on
Jan 1, 1962
Bought by
Williams Shelor Miss
Create a Home Valuation Report for This Property
The Home Valuation Report is an in-depth analysis detailing your home's value as well as a comparison with similar homes in the area
Home Values in the Area
Average Home Value in this Area
Purchase History
| Date | Buyer | Sale Price | Title Company |
|---|---|---|---|
| Sargent R Richard | $200,000 | -- | |
| Lovelace Peggy A | -- | -- | |
| Lovelace John C | $37,200 | -- | |
| Womack Larry Robert | $33,000 | -- | |
| Martin James Ruel | $10,500 | -- | |
| P | -- | -- | |
| Gearheart Louis S | $9,000 | -- | |
| P | $400 | -- | |
| Brannon Carter S | -- | -- | |
| Williams Shelor Miss | -- | -- |
Source: Public Records
Tax History Compared to Growth
Tax History
| Year | Tax Paid | Tax Assessment Tax Assessment Total Assessment is a certain percentage of the fair market value that is determined by local assessors to be the total taxable value of land and additions on the property. | Land | Improvement |
|---|---|---|---|---|
| 2024 | $1,315 | $64,432 | $12,540 | $51,892 |
| 2023 | $1,292 | $61,323 | $11,400 | $49,923 |
| 2022 | $1,012 | $43,965 | $9,480 | $34,485 |
| 2021 | $888 | $36,642 | $8,646 | $27,996 |
| 2020 | $846 | $33,986 | $7,518 | $26,468 |
| 2019 | $809 | $32,436 | $7,518 | $24,918 |
| 2018 | $776 | $30,550 | $7,160 | $23,390 |
| 2017 | $752 | $29,115 | $6,630 | $22,485 |
| 2016 | $749 | $28,502 | $6,600 | $21,902 |
| 2015 | $736 | $28,502 | $6,600 | $21,902 |
| 2014 | $736 | $28,502 | $6,600 | $21,902 |
Source: Public Records
Map
Nearby Homes
- 0 Old Blacks Bluff Rd SW Unit 10652523
- 47 Boyd Rd SW
- 0 Ausburn Rd SW Unit 10611100
- 3686 Blacks Bluff Rd SW
- 0 McGee Bend Rd SW Unit 10351960
- 458 Kraftsman Rd SW
- 0 Morton Bend Rd SW Unit 7665378
- 0 Morton Bend Rd SW Unit 10638763
- 26 Red Fox Dr SW
- LT 5 Morton Bend Rd
- 775 Mays Bridge Rd SW
- 3428 Horseleg Creek Rd SW
- 5 Red Fox Dr SW
- 63 Highlander Trail SW
- 3 SW Highlander Trail SW
- 14 Bryan Springs Rd SW
- 48 Highlander Trail SW
- 3241 Horseleg Creek Rd SW
- 0 Barker Rd SW Unit 10651788
- 0 Barker Rd SW Unit LotWP001
- 1373 Livingston Rd SW
- 1436 Livingston Rd SW
- 1435 Livingston Rd SW
- 1502 Livingston Rd SW
- 1502 Livingston Rd SW
- 1502 Livingston Rd SW
- 1515 Livingston Rd SW
- 1515 Livingston Rd SW
- 1239 Livingston Rd SW
- 1535 Livingston Rd SW
- 1567 Livingston Rd SW
- 1540 Livingston Rd SW
- 1578 Livingston Rd SW
- 1637 Livingston Rd SW
- 1667 Livingston Rd SW
- 322 Livingston Rd SW
- 0 Livingston Rd SW Unit 8541272
- 1691 Livingston Rd SW
- 1039 Livingston Rd SW
- 368 Reece Vann Rd SW