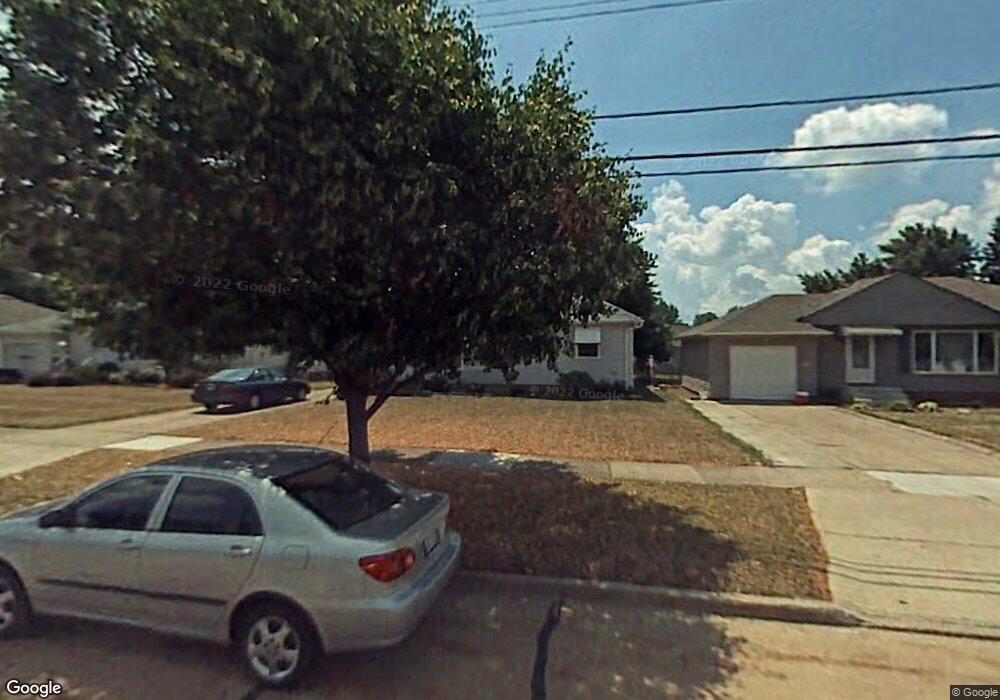
13881 Bellbrook Dr Brookpark, OH 44142
Estimated Value: $213,622 - $235,000
3
Beds
1
Bath
988
Sq Ft
$230/Sq Ft
Est. Value
About This Home
This home is located at 13881 Bellbrook Dr, Brookpark, OH 44142 and is currently estimated at $227,656, approximately $230 per square foot. 13881 Bellbrook Dr is a home located in Cuyahoga County with nearby schools including Berea-Midpark Middle School, Berea-Midpark High School, and Huber Heights Preparatory Academy Parma Academy.
Ownership History
Date
Name
Owned For
Owner Type
Purchase Details
Closed on
Jan 24, 2022
Sold by
Culler David L
Bought by
Culler Nicholas A
Current Estimated Value
Purchase Details
Closed on
May 16, 2014
Sold by
Vallo Mark J
Bought by
Lewis Mathew
Home Financials for this Owner
Home Financials are based on the most recent Mortgage that was taken out on this home.
Original Mortgage
$74,100
Interest Rate
4.28%
Mortgage Type
New Conventional
Purchase Details
Closed on
Jan 21, 2000
Sold by
Placko John D and Placko Karen Karen
Bought by
Culler Kimberly A
Home Financials for this Owner
Home Financials are based on the most recent Mortgage that was taken out on this home.
Original Mortgage
$103,700
Interest Rate
8.21%
Mortgage Type
Purchase Money Mortgage
Purchase Details
Closed on
Nov 16, 1977
Sold by
Churby Theodore and Churby Linda K
Bought by
Placko John D
Purchase Details
Closed on
Jan 1, 1975
Bought by
Churby Theodore and Churby Linda K
Create a Home Valuation Report for This Property
The Home Valuation Report is an in-depth analysis detailing your home's value as well as a comparison with similar homes in the area
Home Values in the Area
Average Home Value in this Area
Purchase History
| Date | Buyer | Sale Price | Title Company |
|---|---|---|---|
| Culler Nicholas A | -- | Ohio Real Title | |
| Lewis Mathew | $78,000 | Boulevard Title Agency | |
| Culler Kimberly A | $122,000 | Affiliated Title | |
| Placko John D | $47,500 | -- | |
| Churby Theodore | -- | -- |
Source: Public Records
Mortgage History
| Date | Status | Borrower | Loan Amount |
|---|---|---|---|
| Previous Owner | Lewis Mathew | $74,100 | |
| Previous Owner | Culler Kimberly A | $103,700 |
Source: Public Records
Tax History Compared to Growth
Tax History
| Year | Tax Paid | Tax Assessment Tax Assessment Total Assessment is a certain percentage of the fair market value that is determined by local assessors to be the total taxable value of land and additions on the property. | Land | Improvement |
|---|---|---|---|---|
| 2024 | $2,909 | $57,680 | $14,490 | $43,190 |
| 2023 | $2,714 | $44,560 | $11,030 | $33,530 |
| 2022 | $2,695 | $44,560 | $11,030 | $33,530 |
| 2021 | $2,679 | $44,560 | $11,030 | $33,530 |
| 2020 | $2,415 | $35,350 | $8,750 | $26,600 |
| 2019 | $2,343 | $101,000 | $25,000 | $76,000 |
| 2018 | $2,333 | $35,350 | $8,750 | $26,600 |
| 2017 | $2,511 | $35,140 | $7,350 | $27,790 |
| 2016 | $2,490 | $35,140 | $7,350 | $27,790 |
| 2015 | $2,225 | $35,140 | $7,350 | $27,790 |
| 2014 | $2,225 | $33,460 | $7,000 | $26,460 |
Source: Public Records
Map
Nearby Homes
- 14344 Fayette Blvd
- 14055 Donald Dr
- 13489 Havendale Dr
- 14417 Parkman Blvd
- 13602 Holland Rd
- 5677 Gateway Ln Unit E504
- 13971 Park Dr
- 6330 Michael Dr
- 6321 W 130th St
- 13879 Zaremba Dr
- 6333 W 130th St
- 6274 Anita Dr
- 15450 Holland Rd
- 6369 Anita Dr
- 15665 Holland Rd
- 6378 Edgehurst Dr
- 6363 Lockhaven Dr
- 15800 Holland Rd
- 5348 W 147th St
- 11914 Tucson Dr
- 13899 Bellbrook Dr
- 13863 Bellbrook Dr
- 13843 Bellbrook Dr
- 13911 Bellbrook Dr
- 13880 Dalebrook Ave
- 13860 Dalebrook Ave
- 13900 Dalebrook Ave
- 13840 Dalebrook Ave
- 13827 Bellbrook Dr
- 13933 Bellbrook Dr
- 13920 Dalebrook Ave
- 13888 Bellbrook Dr
- 13870 Bellbrook Dr
- 13906 Bellbrook Dr
- 13820 Dalebrook Ave
- 13924 Bellbrook Dr
- 13852 Bellbrook Dr
- 13809 Bellbrook Dr
- 13940 Dalebrook Ave
- 13961 Bellbrook Dr