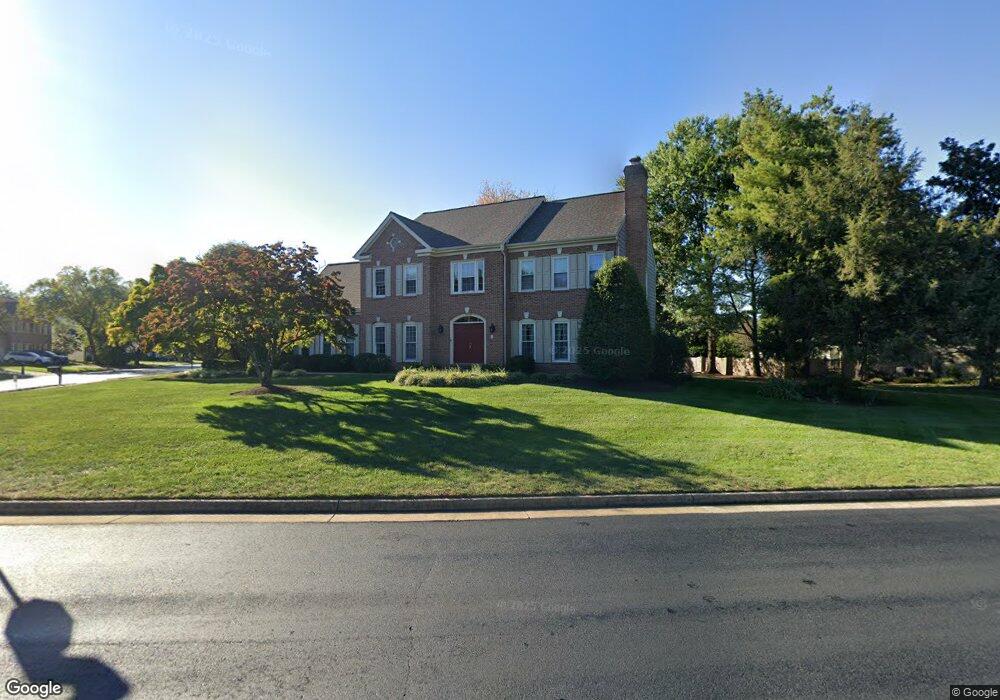
13896 Walney Park Dr Chantilly, VA 20151
Estimated Value: $1,192,000 - $1,311,000
4
Beds
5
Baths
3,524
Sq Ft
$351/Sq Ft
Est. Value
About This Home
This home is located at 13896 Walney Park Dr, Chantilly, VA 20151 and is currently estimated at $1,237,190, approximately $351 per square foot. 13896 Walney Park Dr is a home located in Fairfax County with nearby schools including Poplar Tree Elementary, Rocky Run Middle School, and Chantilly High School.
Ownership History
Date
Name
Owned For
Owner Type
Purchase Details
Closed on
Aug 5, 2004
Sold by
Financia Cendant Mobility
Bought by
Brunner Michael A
Current Estimated Value
Home Financials for this Owner
Home Financials are based on the most recent Mortgage that was taken out on this home.
Original Mortgage
$300,000
Outstanding Balance
$149,062
Interest Rate
6.03%
Mortgage Type
New Conventional
Estimated Equity
$1,088,128
Purchase Details
Closed on
Jul 30, 2004
Sold by
Scoffield Jo M
Bought by
Mobility Financial Corp Cendant
Home Financials for this Owner
Home Financials are based on the most recent Mortgage that was taken out on this home.
Original Mortgage
$300,000
Outstanding Balance
$149,062
Interest Rate
6.03%
Mortgage Type
New Conventional
Estimated Equity
$1,088,128
Purchase Details
Closed on
Sep 27, 2000
Sold by
Olson Warren E
Bought by
Scoffield Jo M
Home Financials for this Owner
Home Financials are based on the most recent Mortgage that was taken out on this home.
Original Mortgage
$378,600
Interest Rate
7.94%
Create a Home Valuation Report for This Property
The Home Valuation Report is an in-depth analysis detailing your home's value as well as a comparison with similar homes in the area
Home Values in the Area
Average Home Value in this Area
Purchase History
| Date | Buyer | Sale Price | Title Company |
|---|---|---|---|
| Brunner Michael A | $787,500 | -- | |
| Mobility Financial Corp Cendant | $787,500 | -- | |
| Scoffield Jo M | $473,250 | -- |
Source: Public Records
Mortgage History
| Date | Status | Borrower | Loan Amount |
|---|---|---|---|
| Open | Brunner Michael A | $300,000 | |
| Previous Owner | Scoffield Jo M | $378,600 |
Source: Public Records
Tax History Compared to Growth
Tax History
| Year | Tax Paid | Tax Assessment Tax Assessment Total Assessment is a certain percentage of the fair market value that is determined by local assessors to be the total taxable value of land and additions on the property. | Land | Improvement |
|---|---|---|---|---|
| 2025 | $12,545 | $1,127,200 | $375,000 | $752,200 |
| 2024 | $12,545 | $1,082,860 | $365,000 | $717,860 |
| 2023 | $11,949 | $1,058,810 | $365,000 | $693,810 |
| 2022 | $11,181 | $977,770 | $355,000 | $622,770 |
| 2021 | $10,082 | $859,130 | $330,000 | $529,130 |
| 2020 | $9,889 | $835,540 | $320,000 | $515,540 |
| 2019 | $9,593 | $810,520 | $310,000 | $500,520 |
| 2018 | $8,612 | $748,860 | $307,000 | $441,860 |
| 2017 | $8,694 | $748,860 | $307,000 | $441,860 |
| 2016 | $8,676 | $748,860 | $307,000 | $441,860 |
| 2015 | $8,034 | $719,870 | $295,000 | $424,870 |
| 2014 | $8,016 | $719,870 | $295,000 | $424,870 |
Source: Public Records
Map
Nearby Homes
- 13802 Poplar Tree Rd
- 4676 Deerwatch Dr
- 4528 Waverly Crossing Ln
- 4627 Deerwatch Dr
- 4619 Deerwatch Dr
- 5127 Woodfield Dr
- 4619 Olivine Dr
- 14130 Gypsum Loop
- 14156 Gypsum Loop Unit 114
- 5155 Woodfield Dr
- 14303 Yesler Ave
- 4915 Longmire Way Unit 124
- 14415 Glencrest Cir Unit 112
- 4902 Longmire Way Unit 24
- 4309 Willoughby Ct
- 5100 Castle Harbor Way Unit 117
- 14437 Glencrest Cir Unit 129
- 5417 Gladewright Dr
- 14256 Newbrook Dr
- 13512 Tabscott Dr
- 4806 Leighfield Valley Dr
- 13898 Walney Park Dr
- 4811 Walney Knoll Ct
- 13894 Walney Park Dr
- 13895 Walney Park Dr
- 13893 Lawrence Park Ct
- 13897 Walney Park Dr
- 4804 Leighfield Valley Dr
- 4809 Walney Knoll Ct
- 13897 Lawrence Park Ct
- 13899 Walney Park Dr
- 13892 Walney Park Dr
- 4812 Walney Knoll Ct
- 13900 Walney Park Dr
- 4802 Leighfield Valley Dr
- 4807 Walney Knoll Ct
- 13890 Lawrence Park Ct
- 4808 Walney Knoll Ct
- 13901 Walney Park Dr
- 13890 Walney Park Dr