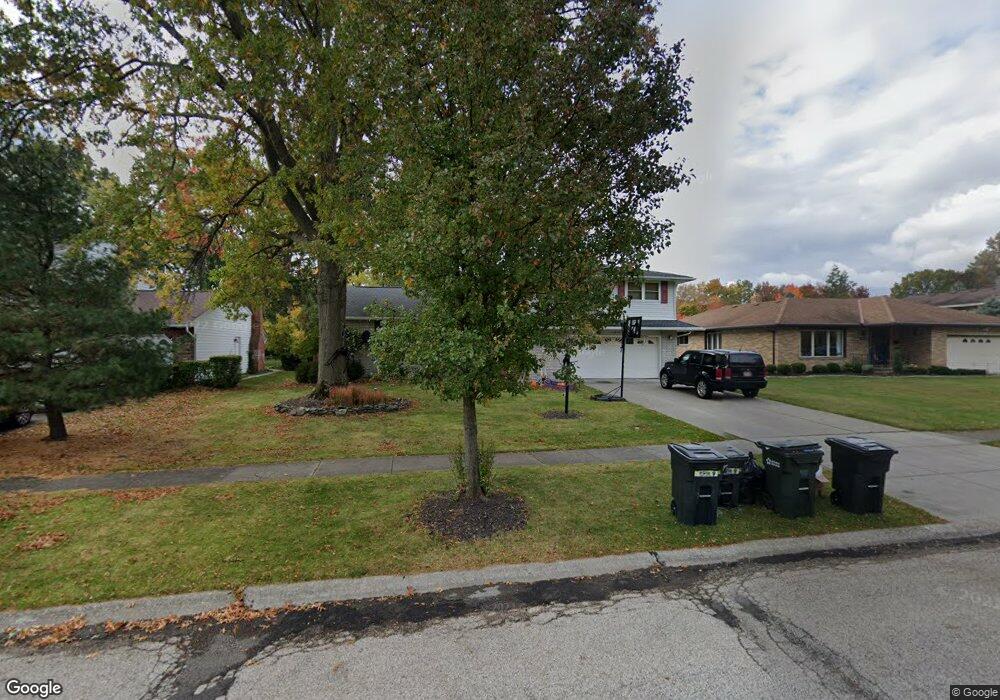
13897 Indian Creek Dr Middleburg Heights, OH 44130
Estimated Value: $325,338 - $358,000
4
Beds
3
Baths
2,236
Sq Ft
$153/Sq Ft
Est. Value
About This Home
This home is located at 13897 Indian Creek Dr, Middleburg Heights, OH 44130 and is currently estimated at $341,835, approximately $152 per square foot. 13897 Indian Creek Dr is a home located in Cuyahoga County with nearby schools including Big Creek Elementary School, Berea-Midpark Middle School, and Berea-Midpark High School.
Ownership History
Date
Name
Owned For
Owner Type
Purchase Details
Closed on
Apr 9, 2019
Sold by
Berwald Angela L and Burlinghaus Angela
Bought by
Berwald Angela L and Angela L Berwald Trust
Current Estimated Value
Purchase Details
Closed on
Oct 20, 1999
Sold by
Cola Elaine T
Bought by
Burlinghaus Angela
Home Financials for this Owner
Home Financials are based on the most recent Mortgage that was taken out on this home.
Original Mortgage
$173,630
Outstanding Balance
$52,747
Interest Rate
7.91%
Mortgage Type
Purchase Money Mortgage
Estimated Equity
$289,088
Purchase Details
Closed on
May 24, 1993
Sold by
Cola Augustine D
Bought by
Cola Elaine T
Purchase Details
Closed on
Dec 8, 1989
Sold by
Gerstenberger Thomas J
Bought by
Cola Augustine D
Purchase Details
Closed on
Dec 28, 1983
Sold by
Riehl Riehl J J and Riehl Jane A
Bought by
Gerstenberger Thomas J
Purchase Details
Closed on
Jan 1, 1975
Bought by
Riehl Riehl J and Riehl Jane A
Create a Home Valuation Report for This Property
The Home Valuation Report is an in-depth analysis detailing your home's value as well as a comparison with similar homes in the area
Home Values in the Area
Average Home Value in this Area
Purchase History
| Date | Buyer | Sale Price | Title Company |
|---|---|---|---|
| Berwald Angela L | -- | None Available | |
| Burlinghaus Angela | $179,000 | Ohio Title Corp | |
| Cola Elaine T | -- | -- | |
| Cola Augustine D | $132,000 | -- | |
| Gerstenberger Thomas J | $91,300 | -- | |
| Riehl Riehl J | -- | -- |
Source: Public Records
Mortgage History
| Date | Status | Borrower | Loan Amount |
|---|---|---|---|
| Open | Burlinghaus Angela | $173,630 |
Source: Public Records
Tax History Compared to Growth
Tax History
| Year | Tax Paid | Tax Assessment Tax Assessment Total Assessment is a certain percentage of the fair market value that is determined by local assessors to be the total taxable value of land and additions on the property. | Land | Improvement |
|---|---|---|---|---|
| 2024 | $5,194 | $98,980 | $18,130 | $80,850 |
| 2023 | $4,660 | $73,190 | $13,790 | $59,400 |
| 2022 | $4,629 | $73,185 | $13,790 | $59,395 |
| 2021 | $4,603 | $73,190 | $13,790 | $59,400 |
| 2020 | $4,512 | $63,110 | $11,900 | $51,210 |
| 2019 | $4,484 | $180,300 | $34,000 | $146,300 |
| 2018 | $4,308 | $63,110 | $11,900 | $51,210 |
| 2017 | $4,469 | $58,320 | $11,240 | $47,080 |
| 2016 | $4,434 | $58,320 | $11,240 | $47,080 |
| 2015 | $4,064 | $58,320 | $11,240 | $47,080 |
| 2014 | $4,064 | $56,600 | $10,920 | $45,680 |
Source: Public Records
Map
Nearby Homes
- 7664 Gerald Dr
- 13541 Indian Creek Dr
- 14280 Pawnee Trail
- 14330 Pawnee Trail
- 14015 Byron Blvd
- 7596 W 130th St
- 7685 Saratoga Rd
- 13976 W Sprague Rd
- 7601 W 130th St
- 7432 Baldwin Creek Dr
- 12972 W Sprague Rd
- 7547 N Linden Ln
- 8761 Windfall Ct
- 12939 W Pleasant Valley Rd
- 7330 Maplewood Rd
- 7444 Briarcliff Pkwy
- 12631 Pinebrook Dr
- 14750 Seneca Trail
- 7475 Lanier Dr
- 7364 Pearl Rd
- 13925 Indian Creek Dr
- 13925 Indian Creek Dr Unit D
- 13871 Indian Creek Dr
- 13872 Trenton Trail
- 13900 Trenton Trail
- 13953 Indian Creek Dr
- 13853 Indian Creek Dr
- 13856 Trenton Trail
- 13926 Trenton Trail
- 13896 Indian Creek Dr
- 13870 Indian Creek Dr
- 13924 Indian Creek Dr
- 13981 Indian Creek Dr
- 13831 Indian Creek Dr
- 13834 Trenton Trail
- 13950 Trenton Trail
- 13952 Indian Creek Dr
- 13852 Indian Creek Dr
- 13852 Indian Creek Dr Unit D
- 14009 Indian Creek Dr