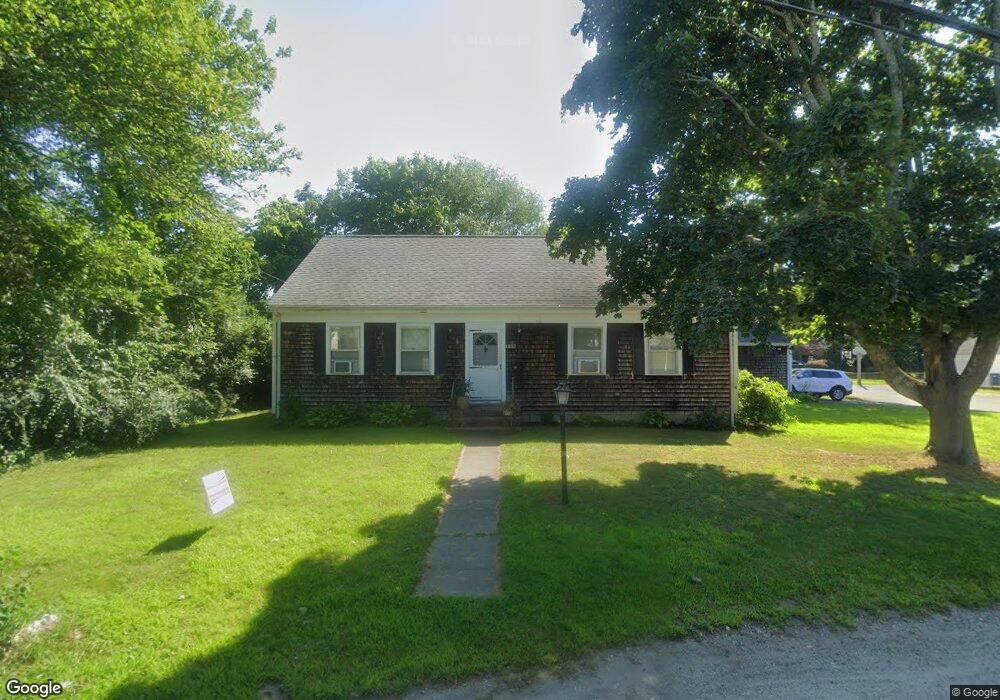
139 Adams St Fairhaven, MA 02719
Oxford NeighborhoodEstimated Value: $527,000 - $604,000
3
Beds
1
Bath
2,079
Sq Ft
$271/Sq Ft
Est. Value
About This Home
This home is located at 139 Adams St, Fairhaven, MA 02719 and is currently estimated at $562,681, approximately $270 per square foot. 139 Adams St is a home located in Bristol County with nearby schools including Fairhaven High School, Alma Del Mar Charter School, and City On A Hill Charter Public School New Bedford.
Ownership History
Date
Name
Owned For
Owner Type
Purchase Details
Closed on
May 28, 2020
Sold by
Rogers John and Kuechler Pamela R
Bought by
Rogers Martha E and Kuechler Pamela R
Current Estimated Value
Create a Home Valuation Report for This Property
The Home Valuation Report is an in-depth analysis detailing your home's value as well as a comparison with similar homes in the area
Home Values in the Area
Average Home Value in this Area
Purchase History
| Date | Buyer | Sale Price | Title Company |
|---|---|---|---|
| Rogers Martha E | -- | None Available |
Source: Public Records
Tax History Compared to Growth
Tax History
| Year | Tax Paid | Tax Assessment Tax Assessment Total Assessment is a certain percentage of the fair market value that is determined by local assessors to be the total taxable value of land and additions on the property. | Land | Improvement |
|---|---|---|---|---|
| 2025 | $37 | $397,300 | $174,000 | $223,300 |
| 2024 | $3,530 | $382,400 | $174,000 | $208,400 |
| 2023 | $3,271 | $328,700 | $152,500 | $176,200 |
| 2022 | $3,163 | $309,500 | $141,700 | $167,800 |
| 2021 | $3,093 | $274,000 | $128,200 | $145,800 |
| 2020 | $3,030 | $274,000 | $128,200 | $145,800 |
| 2019 | $2,867 | $245,700 | $106,300 | $139,400 |
| 2018 | $2,847 | $235,500 | $101,200 | $134,300 |
| 2017 | $2,813 | $233,600 | $101,200 | $132,400 |
| 2016 | $2,804 | $230,200 | $101,200 | $129,000 |
| 2015 | $2,674 | $220,100 | $101,200 | $118,900 |
Source: Public Records
Map
Nearby Homes