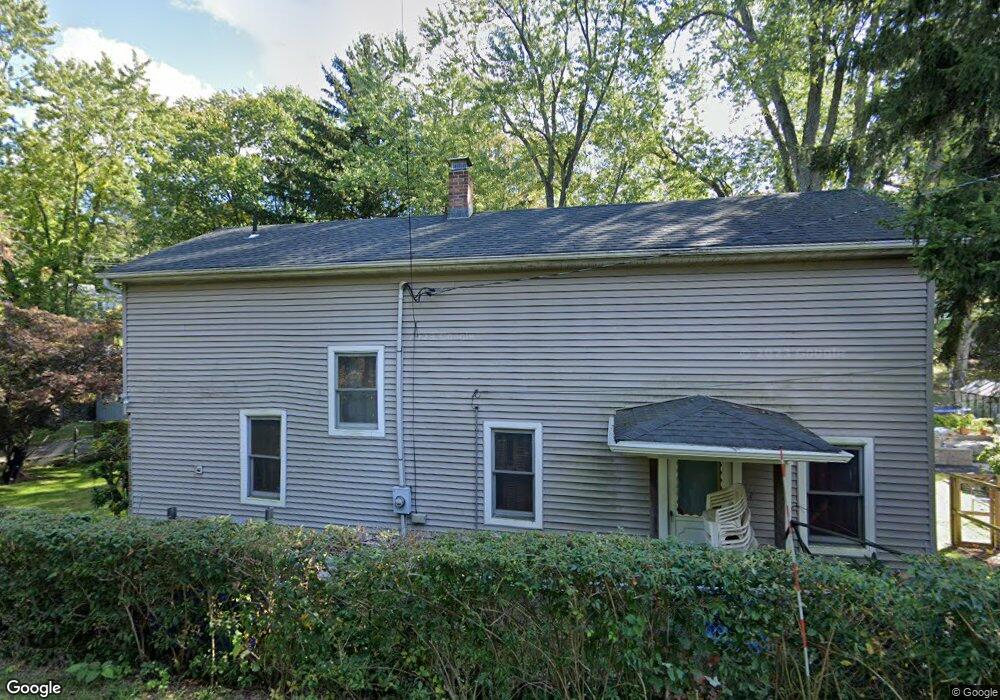
139 Allen St Waterbury, CT 06706
South End District NeighborhoodEstimated Value: $261,717 - $303,000
2
Beds
6
Baths
1,368
Sq Ft
$207/Sq Ft
Est. Value
About This Home
This home is located at 139 Allen St, Waterbury, CT 06706 and is currently estimated at $283,429, approximately $207 per square foot. 139 Allen St is a home located in New Haven County with nearby schools including John G. Gilmartin Elementary School, John F. Kennedy High School, and St Peter & Paul School.
Ownership History
Date
Name
Owned For
Owner Type
Purchase Details
Closed on
Dec 5, 2017
Sold by
Dravis Michael J and Dravis Kathleen M
Bought by
Gobindraj Permaul and Gobindraj Sewraney P
Current Estimated Value
Home Financials for this Owner
Home Financials are based on the most recent Mortgage that was taken out on this home.
Original Mortgage
$86,400
Outstanding Balance
$73,316
Interest Rate
3.88%
Mortgage Type
New Conventional
Estimated Equity
$210,113
Create a Home Valuation Report for This Property
The Home Valuation Report is an in-depth analysis detailing your home's value as well as a comparison with similar homes in the area
Home Values in the Area
Average Home Value in this Area
Purchase History
| Date | Buyer | Sale Price | Title Company |
|---|---|---|---|
| Gobindraj Permaul | $108,000 | -- |
Source: Public Records
Mortgage History
| Date | Status | Borrower | Loan Amount |
|---|---|---|---|
| Open | Gobindraj Permaul | $86,400 | |
| Previous Owner | Gobindraj Permaul | $137,750 | |
| Previous Owner | Gobindraj Permaul | $40,000 | |
| Previous Owner | Gobindraj Permaul | $60,000 |
Source: Public Records
Tax History Compared to Growth
Tax History
| Year | Tax Paid | Tax Assessment Tax Assessment Total Assessment is a certain percentage of the fair market value that is determined by local assessors to be the total taxable value of land and additions on the property. | Land | Improvement |
|---|---|---|---|---|
| 2025 | $4,547 | $101,080 | $18,480 | $82,600 |
| 2024 | $4,997 | $101,080 | $18,480 | $82,600 |
| 2023 | $5,478 | $101,080 | $18,480 | $82,600 |
| 2022 | $3,981 | $66,120 | $18,490 | $47,630 |
| 2021 | $3,981 | $66,120 | $18,490 | $47,630 |
| 2020 | $3,981 | $66,120 | $18,490 | $47,630 |
| 2019 | $3,981 | $66,120 | $18,490 | $47,630 |
| 2018 | $3,981 | $66,120 | $18,490 | $47,630 |
| 2017 | $4,664 | $77,470 | $18,490 | $58,980 |
| 2016 | $4,664 | $77,470 | $18,490 | $58,980 |
| 2015 | $4,510 | $77,470 | $18,490 | $58,980 |
| 2014 | $4,510 | $77,470 | $18,490 | $58,980 |
Source: Public Records
Map
Nearby Homes
- 51 Clover St
- 947 Pearl Lake Rd
- 41 Floyd St
- 0372 Floyd St
- 0039 Floyd St
- 41L Floyd St
- 44 Shadybrook Ln
- 439 Piedmont St
- 170 Purdy Rd
- 335 Raymond St
- 89 Rockledge Dr
- 60 Gayfield Rd
- 21 Whittlesey Ave
- 00 Milton Ave
- 1135 Hamilton Ave
- 242 Madison St
- 273 Piedmont St
- 463 Pearl Lake Rd
- 35 Mountain Village Rd Unit 30
- 62 Mountain View Dr