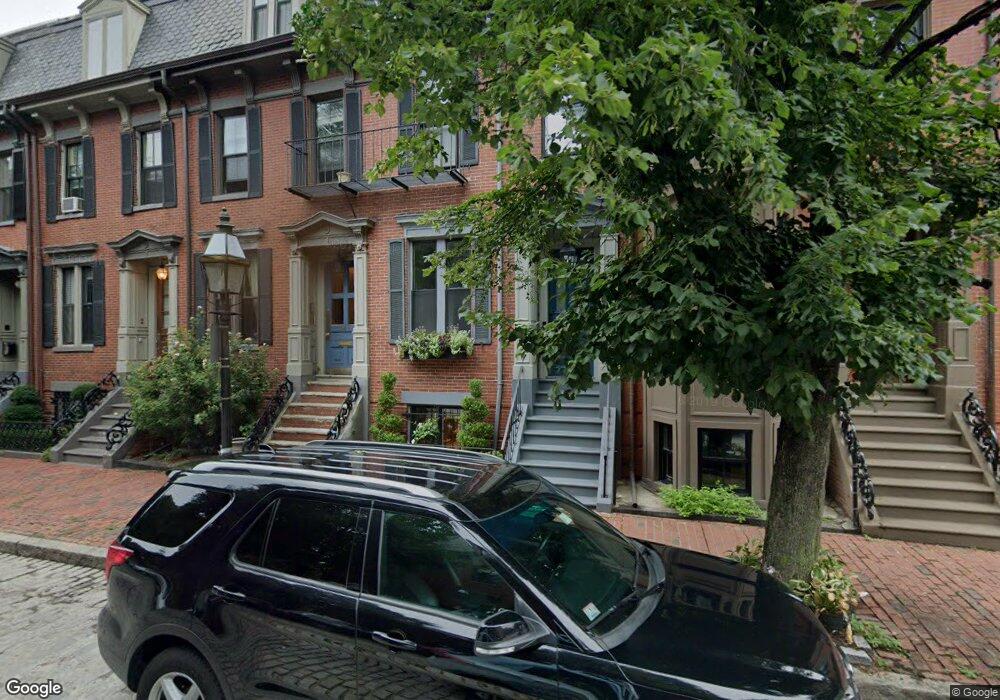
139 Appleton St Boston, MA 02116
South End NeighborhoodEstimated Value: $3,118,000 - $3,881,000
3
Beds
3
Baths
2,200
Sq Ft
$1,551/Sq Ft
Est. Value
About This Home
This home is located at 139 Appleton St, Boston, MA 02116 and is currently estimated at $3,413,241, approximately $1,551 per square foot. 139 Appleton St is a home located in Suffolk County with nearby schools including Kingsley Montessori School and Cathedral High School.
Ownership History
Date
Name
Owned For
Owner Type
Purchase Details
Closed on
Jun 24, 2010
Sold by
Alternative Peter R and Alternative Rachel
Bought by
Connors Travis D and Connors Wendy E
Current Estimated Value
Purchase Details
Closed on
Dec 3, 2003
Sold by
Conley Patricia and Stone Patricia
Bought by
Alternative Peter R and Smith Rachel Ann
Purchase Details
Closed on
Jan 18, 2000
Sold by
Anderson William G and Anderson Yvette H
Bought by
Stone Laurence H and Conley Patricia
Create a Home Valuation Report for This Property
The Home Valuation Report is an in-depth analysis detailing your home's value as well as a comparison with similar homes in the area
Home Values in the Area
Average Home Value in this Area
Purchase History
| Date | Buyer | Sale Price | Title Company |
|---|---|---|---|
| Connors Travis D | $1,610,000 | -- | |
| Alternative Peter R | $1,150,000 | -- | |
| Stone Laurence H | $855,000 | -- |
Source: Public Records
Mortgage History
| Date | Status | Borrower | Loan Amount |
|---|---|---|---|
| Open | Stone Laurence H | $1,110,000 |
Source: Public Records
Tax History
| Year | Tax Paid | Tax Assessment Tax Assessment Total Assessment is a certain percentage of the fair market value that is determined by local assessors to be the total taxable value of land and additions on the property. | Land | Improvement |
|---|---|---|---|---|
| 2025 | $33,200 | $2,867,000 | $907,500 | $1,959,500 |
| 2024 | $27,670 | $2,538,500 | $739,300 | $1,799,200 |
| 2023 | $26,216 | $2,441,000 | $710,900 | $1,730,100 |
| 2022 | $25,546 | $2,348,000 | $683,800 | $1,664,200 |
| 2021 | $23,635 | $2,215,100 | $645,100 | $1,570,000 |
| 2020 | $23,231 | $2,199,900 | $639,700 | $1,560,200 |
| 2019 | $22,518 | $2,136,400 | $529,500 | $1,606,900 |
| 2018 | $21,744 | $2,074,800 | $529,500 | $1,545,300 |
| 2017 | $20,916 | $1,975,100 | $529,500 | $1,445,600 |
| 2016 | $19,932 | $1,812,000 | $529,500 | $1,282,500 |
| 2015 | $20,391 | $1,683,800 | $348,300 | $1,335,500 |
| 2014 | $18,906 | $1,502,900 | $348,300 | $1,154,600 |
Source: Public Records
Map
Nearby Homes
- 150 Appleton St Unit 3E
- 370 Columbus Ave Unit B
- 350 Columbus Ave Unit 6
- 5 Dartmouth Place
- 150 Chandler St Unit 9
- 109 Appleton St
- 11 Dartmouth Place Unit 2
- 6 Yarmouth St Unit 3
- 30 Dartmouth St Unit 3
- 171 Warren Ave Unit 5
- 118 Chandler St Unit 2
- 114 Chandler St Unit 3
- 42 Clarendon St Unit 1
- 300 Columbus Ave Unit 5
- 158 W Canton St
- 587 Tremont St Unit 3
- 70 Clarendon St Unit 1
- 2 Clarendon St Unit 204
- 48 Appleton St
- 29 Holyoke St Unit 1
- 141 Appleton St
- 141 Appleton St Unit 2
- 141 Appleton St Unit 3
- 141 Appleton St Unit 1
- 137 Appleton St
- 143 Appleton St Unit 2
- 143 Appleton St Unit 1
- 135 Appleton St Unit 2
- 135 Appleton St Unit 1
- 135 Appleton St
- 145 Appleton St
- 133 Appleton St
- 133 Appleton St Unit R-1F
- 133 Appleton St Unit 2
- 127 Appleton St Unit 126
- 84 Dartmouth St
- 76 Dartmouth St Unit 80
- 80 Dartmouth St
- 131 Appleton St
- 131 Appleton St Unit 2
Your Personal Tour Guide
Ask me questions while you tour the home.