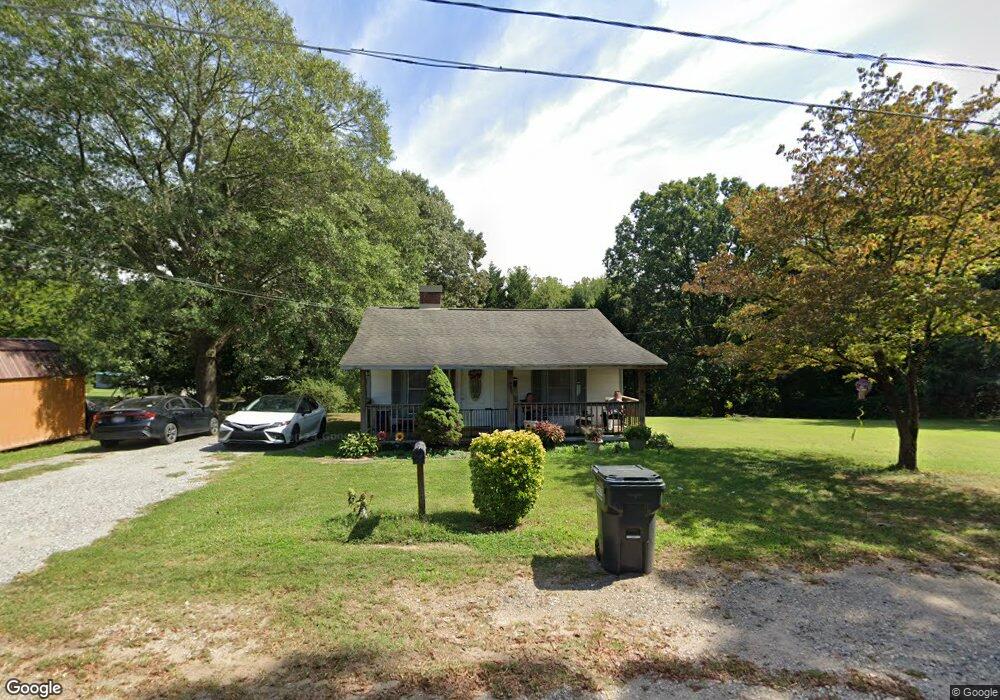
139 Autumn Leaf Rd Troutman, NC 28166
Estimated Value: $178,969 - $261,000
2
Beds
1
Bath
882
Sq Ft
$231/Sq Ft
Est. Value
About This Home
This home is located at 139 Autumn Leaf Rd, Troutman, NC 28166 and is currently estimated at $203,492, approximately $230 per square foot. 139 Autumn Leaf Rd is a home located in Iredell County with nearby schools including Troutman Elementary School, Troutman Middle School, and South Iredell High School.
Ownership History
Date
Name
Owned For
Owner Type
Purchase Details
Closed on
Sep 16, 2004
Sold by
Hud
Bought by
Compton Ronald C and Compton Brenda G
Current Estimated Value
Purchase Details
Closed on
Mar 8, 2004
Sold by
Ganus Timothy S
Bought by
Hud
Purchase Details
Closed on
Jul 12, 2001
Sold by
Mcguire Jack Lynn and Mcguire Michelle B
Bought by
Ganus Timothy S
Home Financials for this Owner
Home Financials are based on the most recent Mortgage that was taken out on this home.
Original Mortgage
$66,457
Interest Rate
7.23%
Mortgage Type
FHA
Purchase Details
Closed on
Nov 24, 1998
Sold by
Bigelow David J and Bigelow Colleen M
Bought by
Mcguire Jack Lynn and Mcguire Michele B
Home Financials for this Owner
Home Financials are based on the most recent Mortgage that was taken out on this home.
Original Mortgage
$51,775
Interest Rate
6.77%
Purchase Details
Closed on
Jun 1, 1995
Create a Home Valuation Report for This Property
The Home Valuation Report is an in-depth analysis detailing your home's value as well as a comparison with similar homes in the area
Home Values in the Area
Average Home Value in this Area
Purchase History
| Date | Buyer | Sale Price | Title Company |
|---|---|---|---|
| Compton Ronald C | -- | -- | |
| Hud | $71,262 | -- | |
| Ganus Timothy S | $67,500 | -- | |
| Mcguire Jack Lynn | $54,500 | -- | |
| -- | $44,500 | -- |
Source: Public Records
Mortgage History
| Date | Status | Borrower | Loan Amount |
|---|---|---|---|
| Previous Owner | Ganus Timothy S | $66,457 | |
| Previous Owner | Mcguire Jack Lynn | $51,775 |
Source: Public Records
Tax History Compared to Growth
Tax History
| Year | Tax Paid | Tax Assessment Tax Assessment Total Assessment is a certain percentage of the fair market value that is determined by local assessors to be the total taxable value of land and additions on the property. | Land | Improvement |
|---|---|---|---|---|
| 2024 | $730 | $111,720 | $40,000 | $71,720 |
| 2023 | $730 | $111,720 | $40,000 | $71,720 |
| 2022 | $476 | $65,180 | $15,000 | $50,180 |
| 2021 | $465 | $65,180 | $15,000 | $50,180 |
| 2020 | $465 | $65,180 | $15,000 | $50,180 |
| 2019 | $449 | $65,180 | $15,000 | $50,180 |
| 2018 | $419 | $61,400 | $16,800 | $44,600 |
| 2017 | $419 | $61,400 | $16,800 | $44,600 |
| 2016 | $419 | $61,400 | $16,800 | $44,600 |
| 2015 | $419 | $61,400 | $16,800 | $44,600 |
| 2014 | $399 | $63,170 | $15,600 | $47,570 |
Source: Public Records
Map
Nearby Homes
- 639 S Eastway Dr
- 104 Aberdeen Dr
- 00 Byers Rd
- 129-131 Shermill Ln
- 135 Falls Leaf Dr Unit 14
- Dickenson Plan at Winecoff Village
- Crane Plan at Winecoff Village
- Frost Plan at Winecoff Village
- Whitman Plan at Winecoff Village
- 193 Calvin Creek Dr
- 422 Wagner St
- 150 Way Cross Ln
- 144 Way Cross Ln
- 142 Way Cross Ln
- 140 Way Cross Ln
- 138 Way Cross Ln
- 147 Way Cross Ln
- 136 Way Cross Ln
- 143 Way Cross Ln
- 134 Way Cross Ln
- 135 Autumn Leaf Rd
- 143 Autumn Leaf Rd
- 131 Autumn Leaf Rd
- 132 Autumn Leaf Rd
- 141 Autumn Leaf Rd
- 125 Autumn Leaf Rd
- 128 Autumn Leaf Rd
- 155 Autumn Leaf Rd
- 114 Fall Hollow Ln
- 150 Autumn Leaf Rd
- 163 Autumn Leaf Rd
- 121 Autumn Leaf Rd
- 109 Fall Hollow Ln
- 169 Autumn Leaf Rd
- 119 Fall Hollow Ln
- 118 Autumn Leaf Rd
- 160 Autumn Leaf Rd
- 115 Autumn Leaf Rd
- 175 Autumn Leaf Rd
- 111 Autumn Leaf Rd