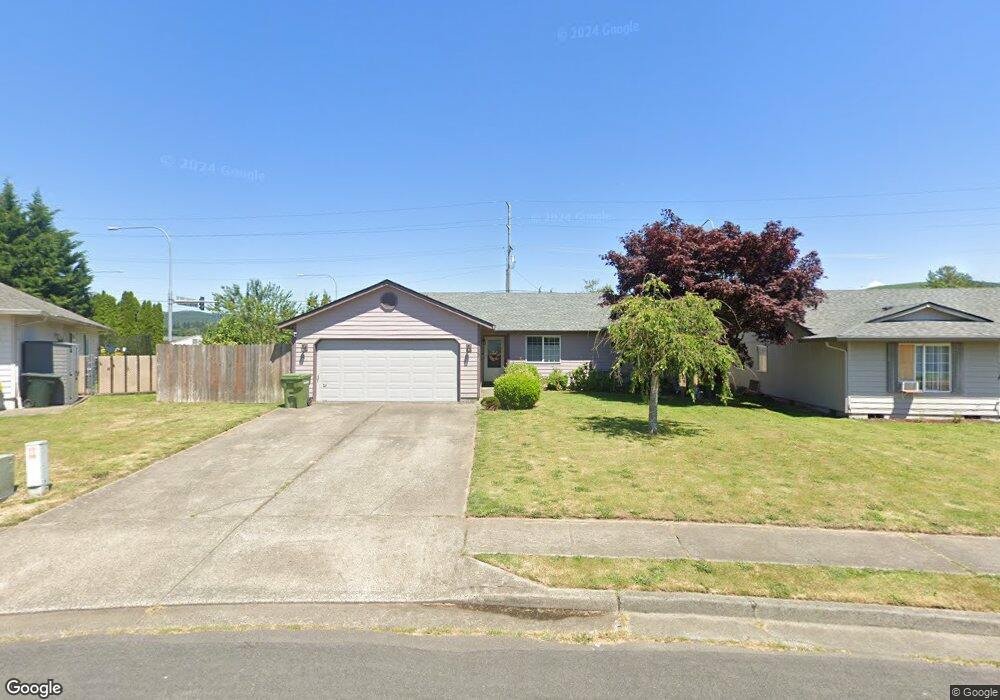
139 Balboa Loop Kelso, WA 98626
Lexington NeighborhoodEstimated Value: $392,000 - $413,000
3
Beds
2
Baths
1,335
Sq Ft
$300/Sq Ft
Est. Value
About This Home
This home is located at 139 Balboa Loop, Kelso, WA 98626 and is currently estimated at $400,222, approximately $299 per square foot. 139 Balboa Loop is a home located in Cowlitz County with nearby schools including Beacon Hill Elementary School, Huntington Middle School, and Kelso High School.
Ownership History
Date
Name
Owned For
Owner Type
Purchase Details
Closed on
Mar 17, 2016
Sold by
Sack Jeffery A
Bought by
Walker Wendy J
Current Estimated Value
Purchase Details
Closed on
Apr 20, 2009
Sold by
Streissguth Brian J and Streissguth Lisa R
Bought by
Sack Jeffery Adam and Sack Wendy J
Home Financials for this Owner
Home Financials are based on the most recent Mortgage that was taken out on this home.
Original Mortgage
$178,762
Interest Rate
5.17%
Mortgage Type
VA
Purchase Details
Closed on
May 17, 2006
Sold by
Dalen Michelle R
Bought by
Streissguth Brian J
Home Financials for this Owner
Home Financials are based on the most recent Mortgage that was taken out on this home.
Original Mortgage
$35,500
Interest Rate
6.13%
Mortgage Type
Fannie Mae Freddie Mac
Create a Home Valuation Report for This Property
The Home Valuation Report is an in-depth analysis detailing your home's value as well as a comparison with similar homes in the area
Home Values in the Area
Average Home Value in this Area
Purchase History
| Date | Buyer | Sale Price | Title Company |
|---|---|---|---|
| Walker Wendy J | -- | Stewart Title Company | |
| Sack Jeffery Adam | $175,000 | Stewart Title | |
| Streissguth Brian J | $177,500 | Chicago Title Ins |
Source: Public Records
Mortgage History
| Date | Status | Borrower | Loan Amount |
|---|---|---|---|
| Previous Owner | Sack Jeffery Adam | $178,762 | |
| Previous Owner | Streissguth Brian J | $35,500 | |
| Previous Owner | Streissguth Brian J | $142,000 |
Source: Public Records
Tax History Compared to Growth
Tax History
| Year | Tax Paid | Tax Assessment Tax Assessment Total Assessment is a certain percentage of the fair market value that is determined by local assessors to be the total taxable value of land and additions on the property. | Land | Improvement |
|---|---|---|---|---|
| 2024 | $4,394 | $311,420 | $53,250 | $258,170 |
| 2023 | $4,176 | $311,550 | $53,250 | $258,300 |
| 2022 | $3,830 | $306,630 | $53,250 | $253,380 |
| 2021 | $3,505 | $263,080 | $53,250 | $209,830 |
| 2020 | $3,437 | $230,610 | $46,300 | $184,310 |
| 2019 | $3,073 | $225,376 | $46,288 | $179,088 |
| 2018 | $2,942 | $191,890 | $46,290 | $145,600 |
| 2017 | $2,663 | $170,690 | $44,080 | $126,610 |
| 2016 | $2,464 | $154,150 | $41,200 | $112,950 |
| 2015 | $2,484 | $144,600 | $41,200 | $103,400 |
| 2013 | -- | $123,050 | $40,000 | $83,050 |
Source: Public Records
Map
Nearby Homes
- 143 Balboa Loop
- 122 Mission Rd
- 1450 Westside Hwy Unit 36
- 118 Adams Dr
- 147 Alameda Dr
- 310 Lexington Ave
- 215 Sparks Dr
- 202 Wyatt Dr
- 157 Chickadee Dr
- 99 Rainbow Way Unit 1
- 304 Lexington Ave
- 109 Indigo Ct
- 178 Decatur Dr
- 106 Villa Rd
- 244 Sparks Dr
- 175 Shoreview Dr
- 151 Shoreview Dr
- 290 Shoreview Dr
- 126 Westminster Dr
- 650 Rainbow Way
- 135 Balboa Loop
- 131 Balboa Loop
- 147 Balboa Loop
- 142 Balboa Loop
- 127 Balboa Loop
- 1440 Westside Hwy
- 151 Balboa Loop
- 154 Balboa Loop
- 136 Balboa Loop
- 123 Balboa Loop
- 160 Balboa Loop
- 130 Balboa Loop
- 119 Balboa Loop
- 155 Balboa Loop
- 166 Balboa Loop
- 163 Balboa Loop
- 124 Balboa Loop
- 115 Balboa Loop
- 1430 Westside Hwy