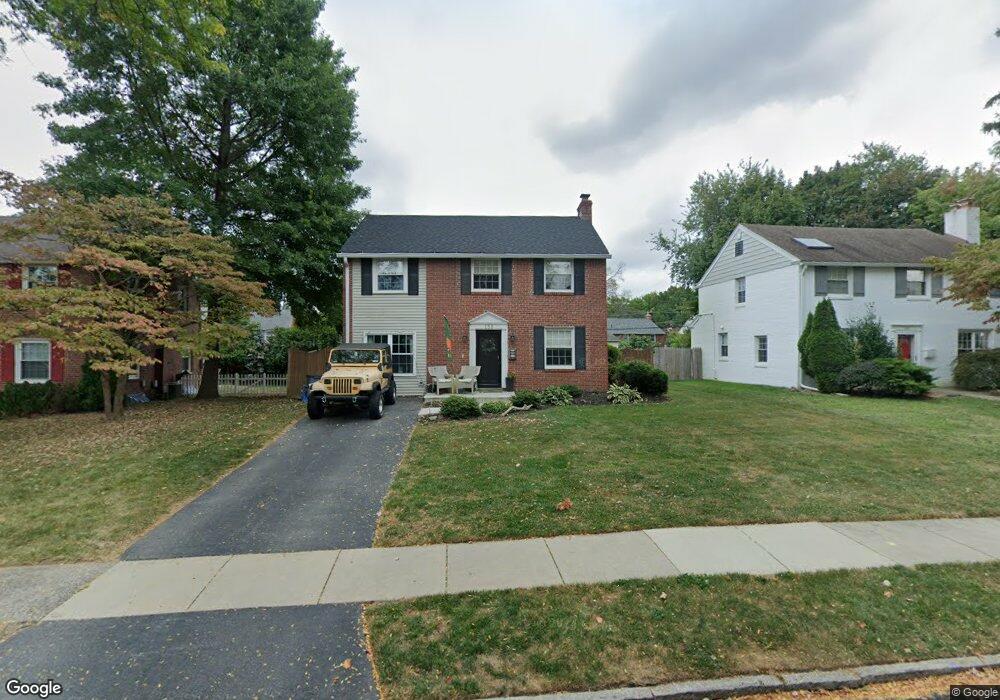
139 Barrie Rd Unit 305 Ardmore, PA 19003
Estimated Value: $555,000 - $654,000
3
Beds
1
Bath
1,286
Sq Ft
$469/Sq Ft
Est. Value
About This Home
This home is located at 139 Barrie Rd Unit 305, Ardmore, PA 19003 and is currently estimated at $603,472, approximately $469 per square foot. 139 Barrie Rd Unit 305 is a home located in Montgomery County with nearby schools including Penn Valley School, Welsh Valley Middle School, and Lower Merion High School.
Ownership History
Date
Name
Owned For
Owner Type
Purchase Details
Closed on
Apr 26, 1999
Sold by
Flanagan Christopher B and Frankenfield Judith G
Bought by
Flanagan Christopher B and Flanagan Judith G
Current Estimated Value
Purchase Details
Closed on
Apr 27, 1996
Sold by
Mcelhenny James P and Mcelhenny Francis H
Bought by
Flanagan Christopher B and Frankenfield Judith G
Create a Home Valuation Report for This Property
The Home Valuation Report is an in-depth analysis detailing your home's value as well as a comparison with similar homes in the area
Home Values in the Area
Average Home Value in this Area
Purchase History
| Date | Buyer | Sale Price | Title Company |
|---|---|---|---|
| Flanagan Christopher B | -- | -- | |
| Flanagan Christopher B | $141,500 | -- |
Source: Public Records
Tax History Compared to Growth
Tax History
| Year | Tax Paid | Tax Assessment Tax Assessment Total Assessment is a certain percentage of the fair market value that is determined by local assessors to be the total taxable value of land and additions on the property. | Land | Improvement |
|---|---|---|---|---|
| 2025 | $6,117 | $146,460 | $53,110 | $93,350 |
| 2024 | $6,117 | $146,460 | $53,110 | $93,350 |
| 2023 | $5,862 | $146,460 | $53,110 | $93,350 |
| 2022 | $5,753 | $146,460 | $53,110 | $93,350 |
| 2021 | $5,622 | $146,460 | $53,110 | $93,350 |
| 2020 | $5,485 | $146,460 | $53,110 | $93,350 |
| 2019 | $5,388 | $146,460 | $53,110 | $93,350 |
| 2018 | $5,388 | $146,460 | $53,110 | $93,350 |
| 2017 | $5,190 | $146,460 | $53,110 | $93,350 |
| 2016 | $5,133 | $146,460 | $53,110 | $93,350 |
| 2015 | $4,786 | $146,460 | $53,110 | $93,350 |
| 2014 | $4,786 | $146,460 | $53,110 | $93,350 |
Source: Public Records
Map
Nearby Homes
- 1525 W Wynnewood Rd
- 442 E Spring Ave
- 64 E Spring Ave
- 754 Oak View Rd
- 761 Hathaway Ln
- 2222 Bryn Mawr Ave
- 28 Chatham Rd
- 222 Lippincott Ave
- 383 Lakeside Rd Unit 105
- 14 Simpson Rd
- 1219 W Wynnewood Rd Unit 311
- 2814 Saint Marys Rd
- 2313 Haverford Rd
- 818 Clifford Ave
- 221 Ardmore Ave
- 2919 Morris Rd
- 2939 Berkley Rd
- 421 E Eagle Rd
- 211 Greenfield Ave
- 109 Village Chatham Unit 109
- 141 Barrie Rd
- 137 Barrie Rd
- 143 Barrie Rd
- 1439 Wynnewood Rd
- 135 Barrie Rd
- 1437 Wynnewood Rd
- 1441 Wynnewood Rd
- 1437 W Wynnewood Rd
- 1435 Wynnewood Rd
- 1443 Wynnewood Rd
- 138 Barrie Rd
- 355 E Spring Ave Unit 324
- 1443 W Wynnewood Rd
- 145 Barrie Rd
- 136 Barrie Rd
- 1433 Wynnewood Rd
- 359 E Spring Ave
- 142 Barrie Rd
- 134 Barrie Rd
- 144 Barrie Rd