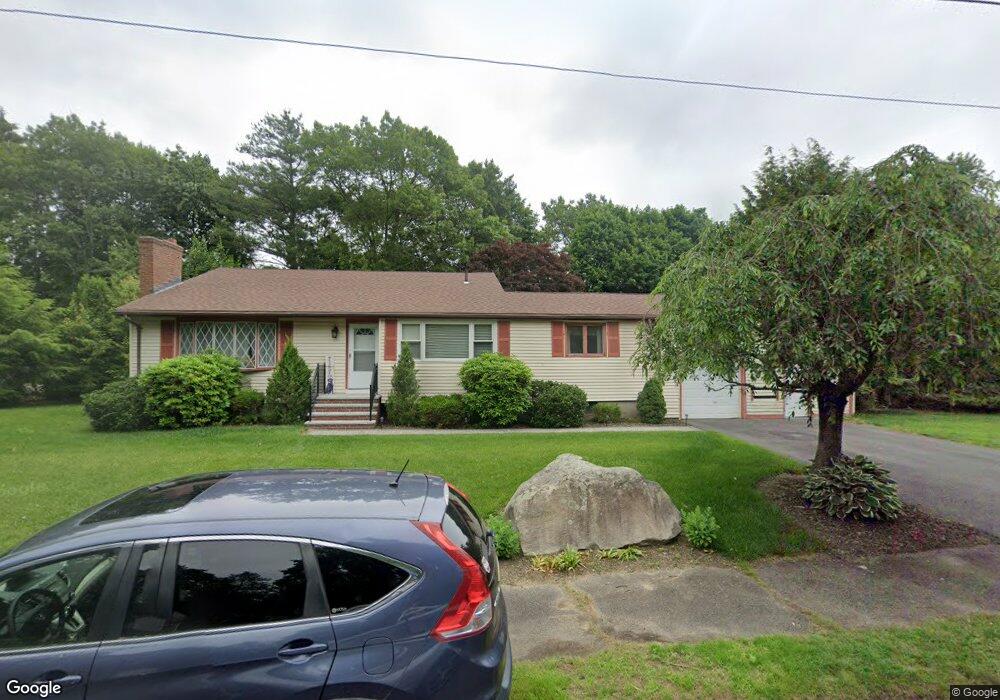
139 Bruce Rd Walpole, MA 02081
Estimated Value: $699,000 - $719,937
3
Beds
2
Baths
1,316
Sq Ft
$541/Sq Ft
Est. Value
About This Home
This home is located at 139 Bruce Rd, Walpole, MA 02081 and is currently estimated at $711,484, approximately $540 per square foot. 139 Bruce Rd is a home located in Norfolk County with nearby schools including Fisher School, Walpole Middle School, and Walpole High School.
Ownership History
Date
Name
Owned For
Owner Type
Purchase Details
Closed on
Oct 19, 2009
Sold by
Kadlick Francis P and Kadlick Jeanne M
Bought by
Harrington Timothy and Harrington Cheryl
Current Estimated Value
Home Financials for this Owner
Home Financials are based on the most recent Mortgage that was taken out on this home.
Original Mortgage
$355,443
Interest Rate
5.14%
Mortgage Type
Purchase Money Mortgage
Purchase Details
Closed on
Dec 21, 1998
Sold by
Burns Charles F and Burns Lorriane M
Bought by
Kadlick Francis P and Kadlick Jeanne M
Home Financials for this Owner
Home Financials are based on the most recent Mortgage that was taken out on this home.
Original Mortgage
$132,000
Interest Rate
6.85%
Mortgage Type
Purchase Money Mortgage
Create a Home Valuation Report for This Property
The Home Valuation Report is an in-depth analysis detailing your home's value as well as a comparison with similar homes in the area
Home Values in the Area
Average Home Value in this Area
Purchase History
We collect this data history from publicly available records. To have your information removed, we recommend requesting removal directly through your county’s website.
| Date | Buyer | Sale Price | Title Company |
|---|---|---|---|
| Harrington Timothy | $362,000 | -- | |
| Kadlick Francis P | $225,000 | -- |
Source: Public Records
Mortgage History
We collect this data history from publicly available records. To have your information removed, we recommend requesting removal directly through your county’s website.
| Date | Status | Borrower | Loan Amount |
|---|---|---|---|
| Open | Kadlick Francis P | $355,012 | |
| Closed | Harrington Timothy | $355,443 | |
| Previous Owner | Kadlick Francis P | $39,000 | |
| Previous Owner | Kadlick Francis P | $132,000 |
Source: Public Records
Tax History
| Year | Tax Paid | Tax Assessment Tax Assessment Total Assessment is a certain percentage of the fair market value that is determined by local assessors to be the total taxable value of land and additions on the property. | Land | Improvement |
|---|---|---|---|---|
| 2025 | $8,106 | $631,800 | $339,500 | $292,300 |
| 2024 | $7,923 | $599,300 | $326,400 | $272,900 |
| 2023 | $7,546 | $543,300 | $283,800 | $259,500 |
| 2022 | $7,117 | $492,200 | $262,900 | $229,300 |
| 2021 | $6,844 | $461,200 | $247,900 | $213,300 |
| 2020 | $6,760 | $451,000 | $233,900 | $217,100 |
| 2019 | $6,534 | $432,700 | $224,900 | $207,800 |
| 2018 | $6,242 | $408,800 | $217,100 | $191,700 |
| 2017 | $6,040 | $394,000 | $208,800 | $185,200 |
| 2016 | $5,866 | $377,000 | $200,800 | $176,200 |
| 2015 | $5,658 | $360,400 | $191,400 | $169,000 |
| 2014 | $5,409 | $343,200 | $191,400 | $151,800 |
Source: Public Records
Map
Nearby Homes
- 12 Charlesgate Rd
- 269 Bullard St
- 28 Lancelot Ct
- 19 and 23 Arlington Ln
- 1080 North St
- 11 Pettees Pond Ln
- 15 Mayflower Rd
- 70 Endicott St Unit 1505
- 70 Endicott St Unit 305
- 56 Yarmouth Rd
- 11 Malvern Rd
- 7 Haynes St
- 16 Foxhunt Trail
- 7 Lilac Ct
- 29 Pilgrim Way
- 0 Charlotte Rd
- 1108 Pennington Dr Unit 1108
- 11 Quincy Ave
- 881 Main St Unit 5
- 5 Powder House Ln Unit 5
- 137 Bruce Rd
- 38 Woodruff Rd
- 46 Woodruff Rd
- 40 Woodruff Rd
- 16 Charlesgate Rd
- 50 Woodruff Rd
- 36 Woodruff Rd
- 131 Bruce Rd
- 42 Woodruff Rd
- 52 Woodruff Rd
- 32 Woodruff Rd
- 15 Charlesgate Rd
- 123 Bruce Rd
- 39 Woodruff Rd
- 49 Woodruff Rd
- 37 Woodruff Rd
- 41 Woodruff Rd
- 47 Woodruff Rd
- 51 Woodruff Rd
- 8 Charlesgate Rd
Your Personal Tour Guide
Ask me questions while you tour the home.