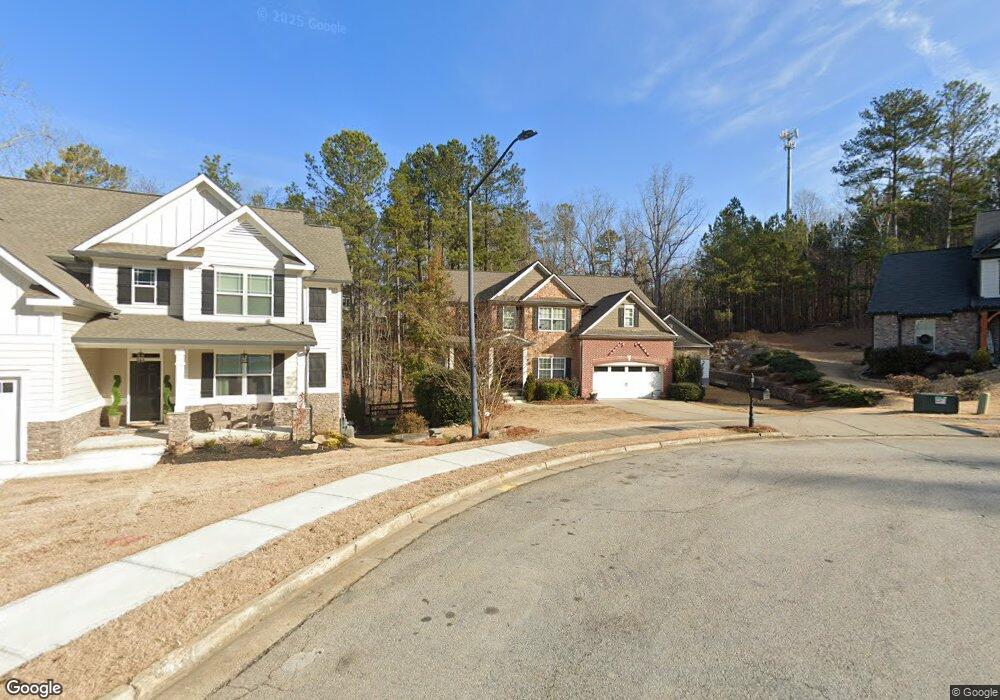
139 Carlton Ct Acworth, GA 30101
Cedarcrest NeighborhoodEstimated Value: $436,000 - $490,000
4
Beds
3
Baths
2,277
Sq Ft
$204/Sq Ft
Est. Value
About This Home
This home is located at 139 Carlton Ct, Acworth, GA 30101 and is currently estimated at $463,640, approximately $203 per square foot. 139 Carlton Ct is a home located in Paulding County with nearby schools including Burnt Hickory Elementary School, Sammy Mcclure Sr. Middle School, and North Paulding High School.
Ownership History
Date
Name
Owned For
Owner Type
Purchase Details
Closed on
May 27, 2014
Sold by
Roach Patricia
Bought by
Roach Tonya
Current Estimated Value
Home Financials for this Owner
Home Financials are based on the most recent Mortgage that was taken out on this home.
Original Mortgage
$157,102
Outstanding Balance
$115,082
Interest Rate
3.25%
Mortgage Type
FHA
Estimated Equity
$348,558
Purchase Details
Closed on
Jan 28, 2011
Sold by
Fremont Home Ln 2005-D
Bought by
Roach Patricia
Home Financials for this Owner
Home Financials are based on the most recent Mortgage that was taken out on this home.
Original Mortgage
$117,500
Interest Rate
4.79%
Mortgage Type
New Conventional
Purchase Details
Closed on
Mar 2, 2010
Sold by
Njoroge Emily N
Bought by
Fremont Home Loan Trust 2005-D
Purchase Details
Closed on
Aug 26, 2005
Sold by
Sharp Residential Llc
Bought by
Njoroge Emily N
Home Financials for this Owner
Home Financials are based on the most recent Mortgage that was taken out on this home.
Original Mortgage
$200,403
Interest Rate
7.25%
Mortgage Type
New Conventional
Create a Home Valuation Report for This Property
The Home Valuation Report is an in-depth analysis detailing your home's value as well as a comparison with similar homes in the area
Home Values in the Area
Average Home Value in this Area
Purchase History
| Date | Buyer | Sale Price | Title Company |
|---|---|---|---|
| Roach Tonya | $160,000 | -- | |
| Roach Patricia | $115,500 | -- | |
| Fremont Home Loan Trust 2005-D | $195,000 | -- | |
| Njoroge Emily N | $250,600 | -- |
Source: Public Records
Mortgage History
| Date | Status | Borrower | Loan Amount |
|---|---|---|---|
| Open | Roach Tonya | $157,102 | |
| Previous Owner | Roach Patricia | $117,500 | |
| Previous Owner | Njoroge Emily N | $200,403 |
Source: Public Records
Tax History Compared to Growth
Tax History
| Year | Tax Paid | Tax Assessment Tax Assessment Total Assessment is a certain percentage of the fair market value that is determined by local assessors to be the total taxable value of land and additions on the property. | Land | Improvement |
|---|---|---|---|---|
| 2024 | $4,364 | $178,692 | $26,000 | $152,692 |
| 2023 | $4,583 | $175,788 | $26,000 | $149,788 |
| 2022 | $3,889 | $149,172 | $26,000 | $123,172 |
| 2021 | $3,398 | $116,916 | $26,000 | $90,916 |
| 2020 | $3,336 | $112,320 | $26,000 | $86,320 |
| 2019 | $3,206 | $106,400 | $26,000 | $80,400 |
| 2018 | $3,010 | $99,920 | $26,000 | $73,920 |
| 2017 | $2,771 | $90,720 | $20,000 | $70,720 |
| 2016 | $2,642 | $87,360 | $20,000 | $67,360 |
| 2015 | $1,970 | $86,120 | $20,000 | $66,120 |
| 2014 | $2,716 | $86,040 | $20,000 | $66,040 |
| 2013 | -- | $76,080 | $20,000 | $56,080 |
Source: Public Records
Map
Nearby Homes
- 148 Carlton Ct
- 262 Lilyfield Ln
- 9 Little Ct
- 1136 Flagstone Way
- 61 Gellmore Ln
- 291 Harmony Cir
- 498 Remington Ln
- 134 Grove Meadow Dr
- 825 Flagstone Way
- 138 Knightwood Point Unit 2
- 266 Cedar Hill Dr Unit 79
- 266 Cedar Hill Dr
- 35 Primrose Dr
- 35 Primrose Dr Unit 60
- 217 Hydrangea Ct
- 217 Hydrangea Ct Unit 30
- 207 Hydrangea Ct
- 62 Cleburne Place
- 27 Rosebud Ln Unit 37
- 27 Rosebud Ln
- 145 Carlton Ct
- 129 Carlton Ct
- 184 Paddington Place
- 119 Carlton Ct
- 196 Paddington Place
- 109 Carlton Ct
- 156 Paddington Place
- 142 Carlton Ct
- 132 Carlton Ct
- 122 Carlton Ct
- 93 Carlton Ct
- 112 Carlton Ct
- 140 Paddington Place
- 265 Lilyfield Ln
- 200 Paddington Place Unit 3
- 85 Carlton Ct
- 255 Lilyfield Ln
- 179 Paddington Place Unit 3
- 271 Lilyfield Ln
- 197 Paddington Place