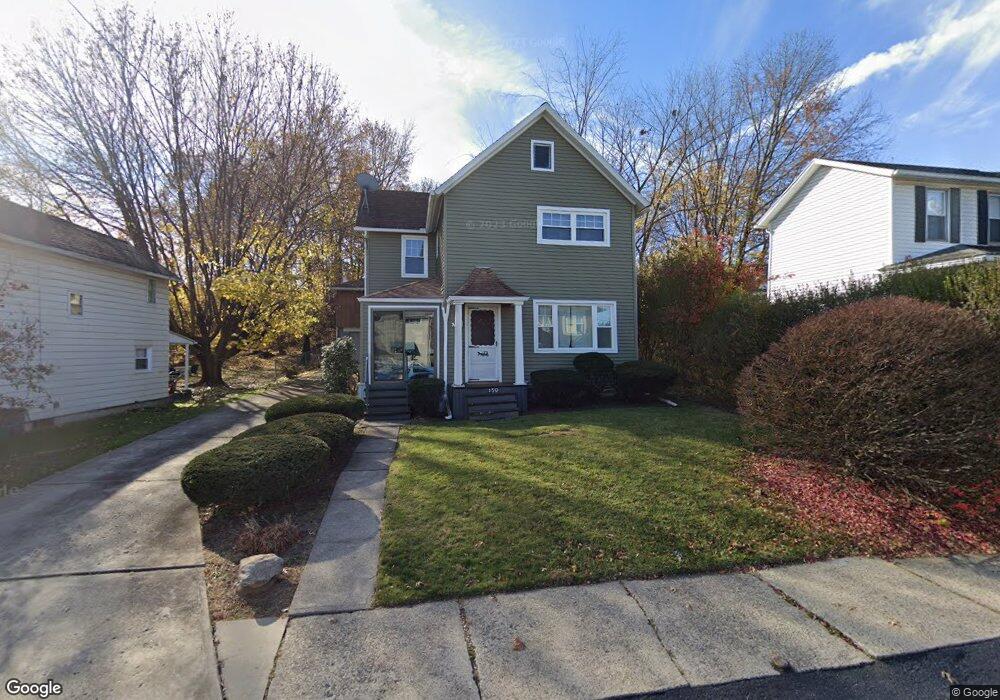
139 Carroll St Pittston, PA 18640
Estimated Value: $174,000 - $242,000
3
Beds
2
Baths
1,950
Sq Ft
$103/Sq Ft
Est. Value
About This Home
This home is located at 139 Carroll St, Pittston, PA 18640 and is currently estimated at $200,593, approximately $102 per square foot. 139 Carroll St is a home located in Luzerne County with nearby schools including Pittston City Intermediate Center, Pittston Area Middle School, and Frederick County Middle School.
Ownership History
Date
Name
Owned For
Owner Type
Purchase Details
Closed on
Feb 26, 2021
Sold by
Baker Stephen and Baker Kelly
Bought by
Haggerty Connor
Current Estimated Value
Home Financials for this Owner
Home Financials are based on the most recent Mortgage that was taken out on this home.
Original Mortgage
$156,150
Interest Rate
3%
Mortgage Type
New Conventional
Purchase Details
Closed on
Feb 15, 2012
Sold by
Baker Ann
Bought by
Baker Stephen
Home Financials for this Owner
Home Financials are based on the most recent Mortgage that was taken out on this home.
Original Mortgage
$86,000
Interest Rate
3.93%
Mortgage Type
New Conventional
Create a Home Valuation Report for This Property
The Home Valuation Report is an in-depth analysis detailing your home's value as well as a comparison with similar homes in the area
Home Values in the Area
Average Home Value in this Area
Purchase History
| Date | Buyer | Sale Price | Title Company |
|---|---|---|---|
| Haggerty Connor | $173,500 | Wetzel Abstract Llc | |
| Baker Stephen | $130,000 | None Available |
Source: Public Records
Mortgage History
| Date | Status | Borrower | Loan Amount |
|---|---|---|---|
| Previous Owner | Haggerty Connor | $156,150 | |
| Previous Owner | Baker Stephen | $86,000 |
Source: Public Records
Tax History Compared to Growth
Tax History
| Year | Tax Paid | Tax Assessment Tax Assessment Total Assessment is a certain percentage of the fair market value that is determined by local assessors to be the total taxable value of land and additions on the property. | Land | Improvement |
|---|---|---|---|---|
| 2025 | $2,091 | $70,300 | $21,200 | $49,100 |
| 2024 | $2,091 | $70,300 | $21,200 | $49,100 |
| 2023 | $2,091 | $70,300 | $21,200 | $49,100 |
| 2022 | $2,078 | $70,300 | $21,200 | $49,100 |
| 2021 | $2,078 | $70,300 | $21,200 | $49,100 |
| 2020 | $2,039 | $70,300 | $21,200 | $49,100 |
| 2019 | $2,025 | $70,300 | $21,200 | $49,100 |
| 2018 | $1,990 | $70,300 | $21,200 | $49,100 |
| 2017 | $1,955 | $70,300 | $21,200 | $49,100 |
| 2016 | -- | $70,300 | $21,200 | $49,100 |
| 2015 | $1,237 | $70,300 | $21,200 | $49,100 |
| 2014 | $1,237 | $70,300 | $21,200 | $49,100 |
Source: Public Records
Map
Nearby Homes