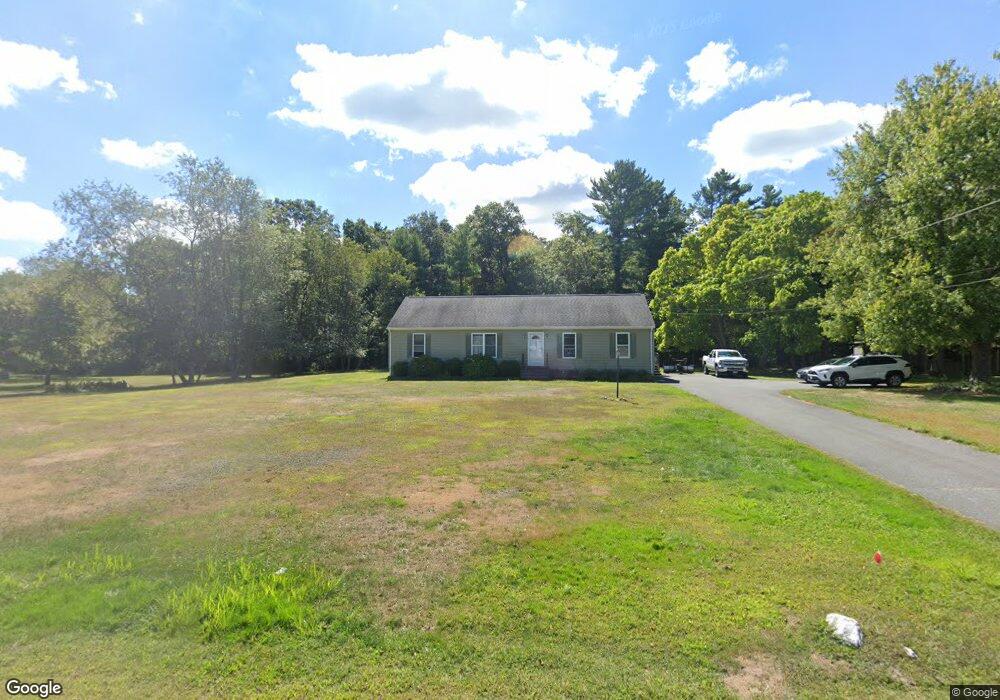
139 Chace Rd East Freetown, MA 02717
Estimated Value: $581,780 - $720,000
3
Beds
2
Baths
1,508
Sq Ft
$423/Sq Ft
Est. Value
About This Home
This home is located at 139 Chace Rd, East Freetown, MA 02717 and is currently estimated at $638,445, approximately $423 per square foot. 139 Chace Rd is a home located in Bristol County with nearby schools including Freetown Elementary School, George R Austin Intermediate School, and Freetown-Lakeville Middle School.
Ownership History
Date
Name
Owned For
Owner Type
Purchase Details
Closed on
Oct 1, 2025
Sold by
Decoffe Stephen E
Bought by
Decoffe Stephen E and Dugan Kathleen F
Current Estimated Value
Purchase Details
Closed on
May 16, 2008
Sold by
Decoffee Stephen E
Bought by
Miller Libaina M and Decoffe Stephen E
Home Financials for this Owner
Home Financials are based on the most recent Mortgage that was taken out on this home.
Original Mortgage
$167,000
Interest Rate
5.91%
Mortgage Type
Purchase Money Mortgage
Purchase Details
Closed on
Dec 30, 1988
Sold by
Dupras Francis A
Bought by
Decoffee Stephen E
Home Financials for this Owner
Home Financials are based on the most recent Mortgage that was taken out on this home.
Original Mortgage
$100,000
Interest Rate
10.26%
Mortgage Type
Purchase Money Mortgage
Create a Home Valuation Report for This Property
The Home Valuation Report is an in-depth analysis detailing your home's value as well as a comparison with similar homes in the area
Home Values in the Area
Average Home Value in this Area
Purchase History
| Date | Buyer | Sale Price | Title Company |
|---|---|---|---|
| Decoffe Stephen E | -- | -- | |
| Miller Libaina M | -- | -- | |
| Miller Libaina M | -- | -- | |
| Decoffee Stephen E | $135,000 | -- |
Source: Public Records
Mortgage History
| Date | Status | Borrower | Loan Amount |
|---|---|---|---|
| Previous Owner | Miller Libaina M | $167,000 | |
| Previous Owner | Decoffee Stephen E | $40,000 | |
| Previous Owner | Decoffee Stephen E | $100,000 |
Source: Public Records
Tax History Compared to Growth
Tax History
| Year | Tax Paid | Tax Assessment Tax Assessment Total Assessment is a certain percentage of the fair market value that is determined by local assessors to be the total taxable value of land and additions on the property. | Land | Improvement |
|---|---|---|---|---|
| 2025 | $4,965 | $501,000 | $167,200 | $333,800 |
| 2024 | $4,971 | $476,600 | $157,700 | $318,900 |
| 2023 | $4,872 | $454,900 | $142,000 | $312,900 |
| 2022 | $4,690 | $388,900 | $120,300 | $268,600 |
| 2021 | $4,545 | $357,900 | $109,400 | $248,500 |
| 2020 | $4,514 | $346,700 | $105,200 | $241,500 |
| 2019 | $4,300 | $327,000 | $100,200 | $226,800 |
| 2018 | $4,082 | $306,700 | $100,200 | $206,500 |
| 2017 | $3,991 | $299,600 | $100,200 | $199,400 |
| 2016 | $3,834 | $292,900 | $97,300 | $195,600 |
| 2015 | $3,776 | $292,700 | $97,300 | $195,400 |
| 2014 | $3,556 | $282,000 | $95,300 | $186,700 |
Source: Public Records
Map
Nearby Homes
- 144 Chace Rd
- 0 Costa Dr
- 195 Slab Bridge Rd
- 24 Bells Brook Rd
- 150 Quanapoag Rd
- 599 Quanapoag Rd
- Lot 2/3 Quanapoag Rd
- 9 Paul Ave
- 1475 Braley Rd Unit 17
- 4597 Acushnet Ave
- 7 Great Cedar Crossing
- 13 Luscomb Ln
- 16 Swallow St
- 5 Freetown St
- 1069 Cherokee St
- 319 Northwest St
- 20 Slab Bridge Rd
- 15 Morrison Way
- 111 High St
- 6 Weetamoe Dr