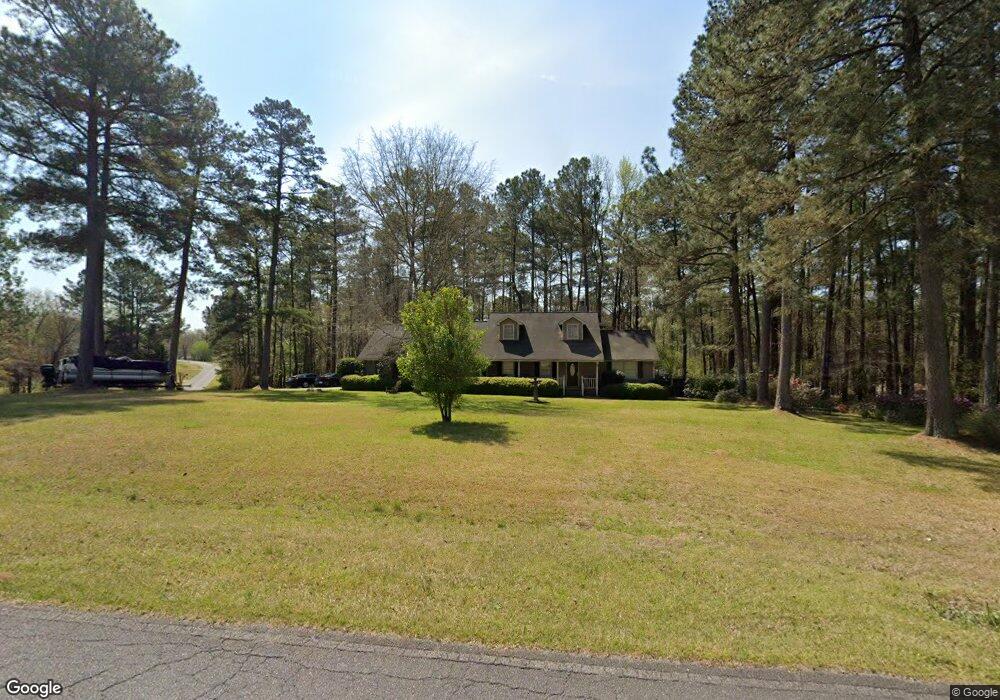
139 Cords Bridge Rd NE Milledgeville, GA 31061
Estimated Value: $296,000 - $359,000
3
Beds
3
Baths
2,204
Sq Ft
$146/Sq Ft
Est. Value
About This Home
This home is located at 139 Cords Bridge Rd NE, Milledgeville, GA 31061 and is currently estimated at $322,813, approximately $146 per square foot. 139 Cords Bridge Rd NE is a home located in Baldwin County with nearby schools including Lakeview Primary, Lakeview Academy, and Oak Hill Middle School.
Ownership History
Date
Name
Owned For
Owner Type
Purchase Details
Closed on
Mar 2, 2023
Sold by
Sikes Jimmy H
Bought by
Sikes Jimmy H and Sikes Nina
Current Estimated Value
Purchase Details
Closed on
May 31, 2002
Sold by
Labelle Trust
Bought by
Sikes Jimmy and Sikes Nina
Purchase Details
Closed on
Jan 20, 1999
Sold by
Labelle Paul R
Bought by
Labelle Trust
Purchase Details
Closed on
Feb 21, 1997
Sold by
Holsey Ardell
Bought by
Labelle Paul R
Create a Home Valuation Report for This Property
The Home Valuation Report is an in-depth analysis detailing your home's value as well as a comparison with similar homes in the area
Home Values in the Area
Average Home Value in this Area
Purchase History
| Date | Buyer | Sale Price | Title Company |
|---|---|---|---|
| Sikes Jimmy H | -- | -- | |
| Sikes Jimmy | $162,000 | -- | |
| Labelle Trust | -- | -- | |
| Labelle Paul R | $130,000 | -- |
Source: Public Records
Tax History Compared to Growth
Tax History
| Year | Tax Paid | Tax Assessment Tax Assessment Total Assessment is a certain percentage of the fair market value that is determined by local assessors to be the total taxable value of land and additions on the property. | Land | Improvement |
|---|---|---|---|---|
| 2025 | $3,497 | $98,156 | $14,400 | $83,756 |
| 2024 | $3,497 | $98,156 | $14,400 | $83,756 |
| 2023 | $2,765 | $77,604 | $12,000 | $65,604 |
| 2022 | $1,690 | $78,340 | $12,000 | $66,340 |
| 2021 | $1,240 | $57,120 | $12,000 | $45,120 |
| 2020 | $1,223 | $57,120 | $12,000 | $45,120 |
| 2019 | $1,226 | $57,120 | $12,000 | $45,120 |
| 2018 | $2,061 | $57,120 | $12,000 | $45,120 |
| 2017 | $1,202 | $57,120 | $12,000 | $45,120 |
Source: Public Records
Map
Nearby Homes
- 330 Greystone Dr
- 103 Cords Bridge Rd NE
- 130 Arlington Ct
- 211 Arbor Way
- 291 Greystone Dr
- 99 Sweetgum Dr
- 270 Greystone Dr
- 131 Carriage Ct NE
- 260 Greystone Dr
- 250 Greystone Dr
- 141 Arbor Way
- 211 Greystone Dr
- 201 Greystone Dr
- 175 Greystone Dr
- 121 Marshall Rd
- 0 Georgia 24
- 2090 N Jefferson St NE
- 121 Marshall Rd NE
- 1954 Twin Oaks Dr
- 2275 Leo Ct
- 137 Cords Bridge Rd NE
- 103 Cambridge Dr S
- 102 Cambridge Dr S
- 100 Cambridge Dr N
- 99 Cambridge Dr N
- 99 N Cambridge Dr
- 138 Cords Bridge Rd NE
- 104 Cambridge Dr S
- 136 Cords Bridge Rd NE
- 105 Cambridge Dr S
- 105 Cambridge Dr N
- 110 Cambridge Ct NE
- 135 Cords Bridge Rd NE
- 106 Cambridge Dr S
- 103 Cambridge Dr N
- 102 Coventry Ct NE
- 110 Cambridge Dr N
- S S Cambridge Dr
- S S Cambridge Dr Unit 39
- 134A Cords Bridge Rd NE