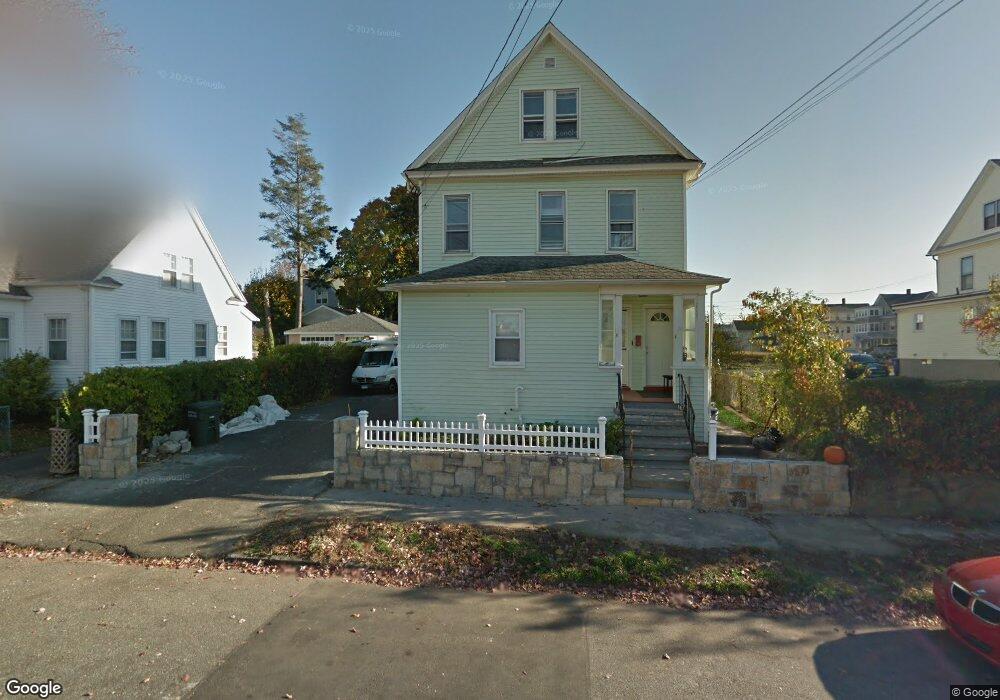
139 Davis Ave Bridgeport, CT 06605
Black Rock NeighborhoodEstimated Value: $509,186 - $625,000
5
Beds
2
Baths
2,224
Sq Ft
$265/Sq Ft
Est. Value
About This Home
This home is located at 139 Davis Ave, Bridgeport, CT 06605 and is currently estimated at $588,797, approximately $264 per square foot. 139 Davis Ave is a home located in Fairfield County with nearby schools including Black Rock School, Bassick High School, and Park City Prep Charter School.
Ownership History
Date
Name
Owned For
Owner Type
Purchase Details
Closed on
Mar 25, 2020
Sold by
Preference Real Estate
Bought by
179 Orland St Llc
Current Estimated Value
Home Financials for this Owner
Home Financials are based on the most recent Mortgage that was taken out on this home.
Original Mortgage
$100,000
Interest Rate
3.4%
Mortgage Type
Balloon
Purchase Details
Closed on
Mar 11, 2015
Sold by
Khantikone Vone
Bought by
Preference Real Est In
Home Financials for this Owner
Home Financials are based on the most recent Mortgage that was taken out on this home.
Original Mortgage
$140,000
Interest Rate
3.67%
Mortgage Type
New Conventional
Purchase Details
Closed on
Sep 10, 2009
Sold by
Khantkong Khanfeng and Khantikone Vone
Bought by
Lhantikone Vone
Purchase Details
Closed on
Jun 30, 1994
Sold by
Fnma
Bought by
Khantikone Khamfeng and Khantikone Vone
Create a Home Valuation Report for This Property
The Home Valuation Report is an in-depth analysis detailing your home's value as well as a comparison with similar homes in the area
Home Values in the Area
Average Home Value in this Area
Purchase History
| Date | Buyer | Sale Price | Title Company |
|---|---|---|---|
| 179 Orland St Llc | -- | None Available | |
| 179 Orland St Llc | -- | None Available | |
| Preference Real Est In | -- | -- | |
| Preference Real Est In | -- | -- | |
| Lhantikone Vone | -- | -- | |
| Lhantikone Vone | -- | -- | |
| Khantikone Khamfeng | $39,900 | -- | |
| Khantikone Khamfeng | $39,900 | -- |
Source: Public Records
Mortgage History
| Date | Status | Borrower | Loan Amount |
|---|---|---|---|
| Previous Owner | 179 Orland St Llc | $100,000 | |
| Previous Owner | Khantikone Khamfeng | $140,000 |
Source: Public Records
Tax History Compared to Growth
Tax History
| Year | Tax Paid | Tax Assessment Tax Assessment Total Assessment is a certain percentage of the fair market value that is determined by local assessors to be the total taxable value of land and additions on the property. | Land | Improvement |
|---|---|---|---|---|
| 2025 | $9,496 | $218,540 | $109,070 | $109,470 |
| 2024 | $9,496 | $218,540 | $109,070 | $109,470 |
| 2023 | $9,496 | $218,540 | $109,070 | $109,470 |
| 2022 | $9,496 | $218,540 | $109,070 | $109,470 |
| 2021 | $9,496 | $218,540 | $109,070 | $109,470 |
| 2020 | $7,597 | $140,710 | $49,180 | $91,530 |
| 2019 | $7,597 | $140,710 | $49,180 | $91,530 |
| 2018 | $7,650 | $140,710 | $49,180 | $91,530 |
| 2017 | $7,650 | $140,710 | $49,180 | $91,530 |
| 2016 | $6,937 | $127,590 | $49,180 | $78,410 |
| 2015 | $6,572 | $155,730 | $51,410 | $104,320 |
| 2014 | $6,572 | $155,730 | $51,410 | $104,320 |
Source: Public Records
Map
Nearby Homes
- 144 Whittier St
- 82 Waldorf Ave
- 167 Scofield Ave
- 135 Whittier St
- 105 Scofield Ave
- 31 Whittier St
- 25 Whittier St
- 166 Alfred St
- 118 Berwick Ave
- 130 Brentwood Ave
- 51 Princeton St
- 145 Brentwood Ave
- 855 Brewster St Unit 857
- 2773 Fairfield Ave Unit 3
- 37 Rowsley St Unit 6
- 26 Rowsley St Unit 3
- 20 Haddon St Unit 5
- 165 Bennett St
- 554 Brewster St Unit 4
- 222 Ellsworth St
- 127 Davis Ave
- 282 Scofield Ave
- 111 Davis Ave
- 270 Hansen Ave
- 264 Scofield Ave
- 254 Scofield Ave
- 105 Davis Ave
- 290 Hansen Ave
- 260 Hansen Ave
- 97 Davis Ave
- 97 Davis Ave Unit 2
- 97 Davis Ave Unit 1
- 250 Hansen Ave
- 106 Davis Ave
- 267 Scofield Ave
- 248 Hansen Ave
- 277 Scofield Ave Unit 12
- 277 Scofield Ave
- 277 Scofield Ave Unit 15