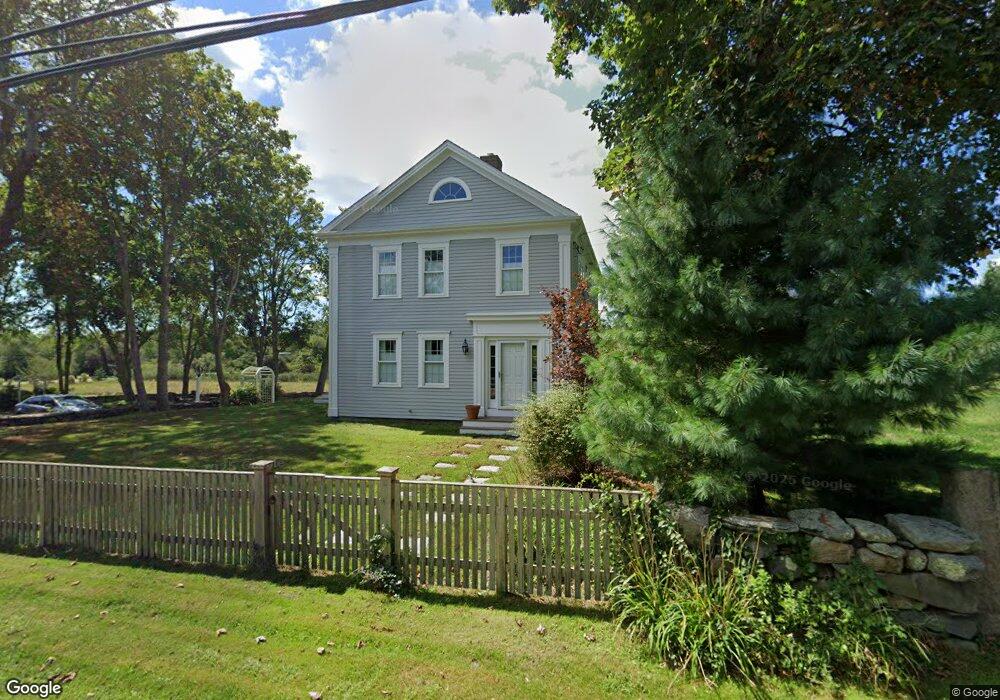
139 E Main Rd Little Compton, RI 02837
Estimated Value: $884,000 - $1,251,913
4
Beds
4
Baths
2,712
Sq Ft
$398/Sq Ft
Est. Value
About This Home
This home is located at 139 E Main Rd, Little Compton, RI 02837 and is currently estimated at $1,078,978, approximately $397 per square foot. 139 E Main Rd is a home located in Newport County with nearby schools including Wilbur & McMahon School.
Ownership History
Date
Name
Owned For
Owner Type
Purchase Details
Closed on
Dec 2, 2009
Sold by
Bank Of America Na
Bought by
Purcell Robert J
Current Estimated Value
Purchase Details
Closed on
Mar 13, 2009
Sold by
Harnedy Majorie
Bought by
Countrywide Bk
Purchase Details
Closed on
Apr 26, 2004
Sold by
Gagne Steven and Gagne Wendy
Bought by
Harnedy 2Nd Francis and Harnedy Marjorie
Home Financials for this Owner
Home Financials are based on the most recent Mortgage that was taken out on this home.
Original Mortgage
$400,000
Interest Rate
5.4%
Mortgage Type
Purchase Money Mortgage
Create a Home Valuation Report for This Property
The Home Valuation Report is an in-depth analysis detailing your home's value as well as a comparison with similar homes in the area
Home Values in the Area
Average Home Value in this Area
Purchase History
| Date | Buyer | Sale Price | Title Company |
|---|---|---|---|
| Purcell Robert J | $300,000 | -- | |
| Countrywide Bk | $410,500 | -- | |
| Harnedy 2Nd Francis | $520,000 | -- |
Source: Public Records
Mortgage History
| Date | Status | Borrower | Loan Amount |
|---|---|---|---|
| Previous Owner | Harnedy 2Nd Francis | $400,000 | |
| Previous Owner | Harnedy 2Nd Francis | $115,000 | |
| Previous Owner | Harnedy 2Nd Francis | $105,000 |
Source: Public Records
Tax History
| Year | Tax Paid | Tax Assessment Tax Assessment Total Assessment is a certain percentage of the fair market value that is determined by local assessors to be the total taxable value of land and additions on the property. | Land | Improvement |
|---|---|---|---|---|
| 2025 | $4,536 | $946,900 | $241,700 | $705,200 |
| 2024 | $4,493 | $884,500 | $191,000 | $693,500 |
| 2023 | $4,387 | $884,500 | $191,000 | $693,500 |
| 2022 | $4,334 | $884,500 | $191,000 | $693,500 |
| 2021 | $3,651 | $604,400 | $166,600 | $437,800 |
| 2020 | $3,620 | $604,400 | $166,600 | $437,800 |
| 2019 | $3,584 | $604,400 | $166,600 | $437,800 |
| 2018 | $3,167 | $531,300 | $166,600 | $364,700 |
| 2016 | $3,012 | $531,300 | $166,600 | $364,700 |
| 2015 | $3,065 | $533,100 | $151,700 | $381,400 |
| 2014 | $3,007 | $533,100 | $151,700 | $381,400 |
Source: Public Records
Map
Nearby Homes
- 27 Friendship Farm Ln
- 23 Friendship Farm Ln
- 65 Snell Rd
- 21 Friendship Farm Ln
- 156 E Main Rd N
- 156 E Main Rd
- 125 E Main Rd
- 17 Friendship Farm Ln
- 14 Friendship Farm Ln
- 0 Friendship Farm Ln
- 3 Friendship Farm Ln
- 119 E Main Rd
- 22 Friendship Farm Ln
- 10 Friendship Farm Ln
- 166 E Main Rd
- 60 Snell Rd
- 155 E Main Rd
- 4 Friendship Farm Ln
- 26 Friendship Farm Ln
- 165 E Main Rd
Your Personal Tour Guide
Ask me questions while you tour the home.