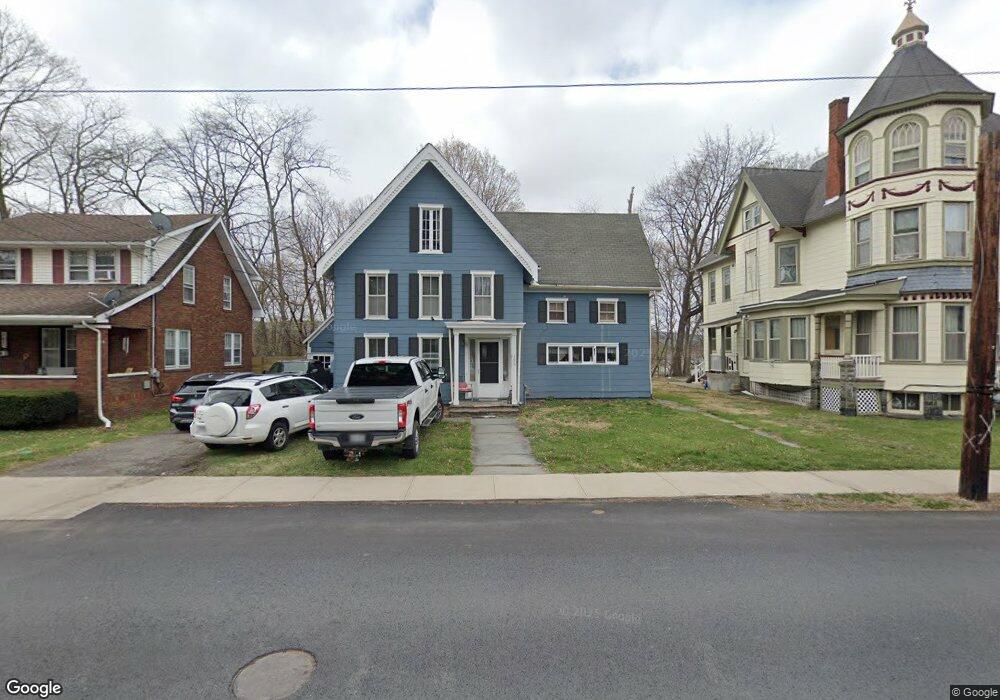
139 E Main St Port Jervis, NY 12771
Estimated Value: $308,644 - $364,000
3
Beds
2
Baths
2,062
Sq Ft
$163/Sq Ft
Est. Value
About This Home
This home is located at 139 E Main St, Port Jervis, NY 12771 and is currently estimated at $335,911, approximately $162 per square foot. 139 E Main St is a home located in Orange County with nearby schools including Port Jervis High School and New Life Christian Day School.
Ownership History
Date
Name
Owned For
Owner Type
Purchase Details
Closed on
Feb 7, 2023
Sold by
Monteleone John W
Bought by
Belanger Jake and Belanger Alicia S
Current Estimated Value
Purchase Details
Closed on
Nov 9, 2022
Sold by
Mae Fannie
Bought by
Monteleone John W
Purchase Details
Closed on
Apr 16, 2018
Sold by
Hsbc Bank Usa Na
Bought by
Miglionico Leonard
Purchase Details
Closed on
Dec 6, 2017
Sold by
Mcrae Regina
Bought by
Hsbc Bank Usa Na
Purchase Details
Closed on
May 23, 2003
Sold by
Mendicino Mia E
Bought by
Huntington Timothy P
Purchase Details
Closed on
Apr 8, 2003
Sold by
Roberts Richard K
Bought by
Mendicino Mia
Create a Home Valuation Report for This Property
The Home Valuation Report is an in-depth analysis detailing your home's value as well as a comparison with similar homes in the area
Home Values in the Area
Average Home Value in this Area
Purchase History
| Date | Buyer | Sale Price | Title Company |
|---|---|---|---|
| Belanger Jake | $275,000 | First American Title | |
| Monteleone John W | $172,500 | None Available | |
| Monteleone John W | $172,500 | None Available | |
| Monteleone John W | $172,500 | None Available | |
| Miglionico Leonard | $46,022 | -- | |
| Miglionico Leonard | $46,022 | -- | |
| Miglionico Leonard | $46,022 | -- | |
| Hsbc Bank Usa Na | $317,884 | -- | |
| Hsbc Bank Usa Na | $317,884 | -- | |
| Hsbc Bank Usa Na | $317,884 | -- | |
| Huntington Timothy P | -- | Vern S Lazaroff | |
| Huntington Timothy P | -- | Vern S Lazaroff | |
| Mendicino Mia | $177,000 | Vern S. Lazaroff | |
| Mendicino Mia | $177,000 | Vern S. Lazaroff |
Source: Public Records
Tax History Compared to Growth
Tax History
| Year | Tax Paid | Tax Assessment Tax Assessment Total Assessment is a certain percentage of the fair market value that is determined by local assessors to be the total taxable value of land and additions on the property. | Land | Improvement |
|---|---|---|---|---|
| 2024 | $4,663 | $64,950 | $5,275 | $59,675 |
| 2023 | $4,663 | $64,950 | $5,275 | $59,675 |
| 2022 | $5,958 | $64,950 | $5,275 | $59,675 |
| 2021 | $5,158 | $64,950 | $5,275 | $59,675 |
| 2020 | $5,289 | $64,950 | $5,275 | $59,675 |
| 2019 | $7,497 | $64,950 | $5,275 | $59,675 |
| 2018 | $7,497 | $64,950 | $5,275 | $59,675 |
| 2017 | $5,109 | $64,950 | $5,275 | $59,675 |
| 2016 | $6,633 | $64,950 | $5,275 | $59,675 |
| 2015 | -- | $64,950 | $5,275 | $59,675 |
| 2014 | -- | $64,950 | $5,275 | $59,675 |
Source: Public Records
Map
Nearby Homes
- 142 Ball St
- 172 Front St Unit 172
- 165 Front St
- 115 Hammond St
- 138 Front St Unit 140
- 9 Carpenter Rd
- 39 Church St Unit 3
- 39 Church St Unit 22
- 39 Church St Unit 53
- 39 Church St Unit 4
- 189 E Main St
- 178-180 Ball St
- 120 Jersey Ave
- 131 Front St
- 109 US Highway 6
- 122 Front St
- 14 Division St
- 105 Fowler St
- 92 Front St
- 701 United States Route 209
- 141 E Main St
- 137 E Main St Unit 3
- 137 E Main St Unit 1
- 137 E Main St Unit 6
- 137 E Main St Unit 2
- 137 E Main St
- 137 E Main St Unit 4
- 143 E Main St
- 145 E Main St
- 142 E Main St
- 131 E Main St
- 144 E Main St
- 140 E Main St
- 146 E Main St
- 79 Barcelow St
- 136 E Main St Unit 138
- 129 E Main St
- 77 Barcelow St
- 134 E Main St
- 127 E Main St