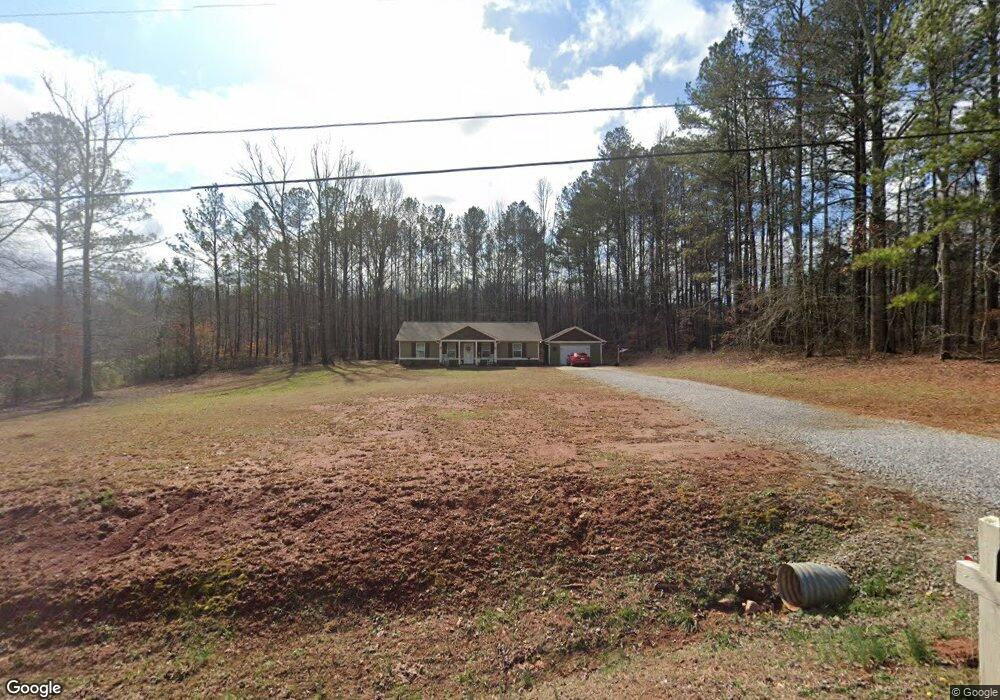
139 E Ranchette Rd Temple, GA 30179
Estimated Value: $285,000 - $318,000
3
Beds
2
Baths
1,380
Sq Ft
$220/Sq Ft
Est. Value
About This Home
This home is located at 139 E Ranchette Rd, Temple, GA 30179 and is currently estimated at $303,078, approximately $219 per square foot. 139 E Ranchette Rd is a home with nearby schools including Providence Elementary School, Temple Middle School, and Temple High School.
Ownership History
Date
Name
Owned For
Owner Type
Purchase Details
Closed on
Jun 8, 2021
Sold by
Harris Dale L
Bought by
Cook Phillip Levi
Current Estimated Value
Home Financials for this Owner
Home Financials are based on the most recent Mortgage that was taken out on this home.
Original Mortgage
$177,365
Outstanding Balance
$159,881
Interest Rate
2.9%
Mortgage Type
New Conventional
Estimated Equity
$143,197
Purchase Details
Closed on
Feb 5, 2021
Sold by
Godwin Charles David
Bought by
Harris Dale L
Purchase Details
Closed on
Mar 13, 2020
Sold by
Rooker Susie
Bought by
Godwin Tammy and Godwin Charles David
Home Financials for this Owner
Home Financials are based on the most recent Mortgage that was taken out on this home.
Original Mortgage
$11,250
Interest Rate
3.4%
Mortgage Type
New Conventional
Purchase Details
Closed on
Jul 21, 1995
Sold by
Rooker
Bought by
Rooker Susie
Purchase Details
Closed on
May 21, 1993
Sold by
Hogan
Bought by
Rooker
Purchase Details
Closed on
Jul 1, 1984
Bought by
Hogan
Create a Home Valuation Report for This Property
The Home Valuation Report is an in-depth analysis detailing your home's value as well as a comparison with similar homes in the area
Home Values in the Area
Average Home Value in this Area
Purchase History
| Date | Buyer | Sale Price | Title Company |
|---|---|---|---|
| Cook Phillip Levi | $186,700 | -- | |
| Harris Dale L | $18,000 | -- | |
| Godwin Tammy | $11,250 | -- | |
| Rooker Susie | -- | -- | |
| Rooker | $32,000 | -- | |
| Hogan | -- | -- |
Source: Public Records
Mortgage History
| Date | Status | Borrower | Loan Amount |
|---|---|---|---|
| Open | Cook Phillip Levi | $177,365 | |
| Previous Owner | Godwin Tammy | $11,250 |
Source: Public Records
Tax History
| Year | Tax Paid | Tax Assessment Tax Assessment Total Assessment is a certain percentage of the fair market value that is determined by local assessors to be the total taxable value of land and additions on the property. | Land | Improvement |
|---|---|---|---|---|
| 2025 | $2,611 | $116,742 | $14,456 | $102,286 |
| 2024 | $2,641 | $116,742 | $14,456 | $102,286 |
| 2023 | $2,641 | $105,297 | $11,565 | $93,732 |
| 2022 | $1,873 | $82,954 | $7,710 | $75,244 |
| 2021 | $115 | $9,595 | $6,168 | $3,427 |
| 2020 | $224 | $7,092 | $5,607 | $1,485 |
| 2019 | $229 | $7,213 | $5,728 | $1,485 |
| 2018 | $222 | $6,839 | $5,354 | $1,485 |
| 2017 | $223 | $6,839 | $5,354 | $1,485 |
| 2016 | $223 | $8,463 | $5,354 | $3,109 |
| 2015 | $279 | $9,989 | $7,019 | $2,970 |
| 2014 | $281 | $9,990 | $7,019 | $2,970 |
Source: Public Records
Map
Nearby Homes
- 101 Robindale Ln
- 133 Greentree Trail
- 133 Pebblebrook Way
- 139 Clover Ct
- 147 Camp Godwin Rd
- 180 Labelle Rd
- 100 Gordons Lake Dr
- 223 Sunlight Cove
- 118 Raven Rd
- 122 Wesley Chapel Ln
- 0 Old Draketown Trail (5 62 Ac) Unit 293
- 21 + - Acres On Allgood Church Rd
- 0 Old Draketown Trail (5 62 Ac) Unit 10711831
- 18 Holder Rd
- 105 Chrissy Dr
- 1021 Cown Rd
- 415 Old Draketown Trail
- 102 Pine Bark Dr
- 425 Little Mac Ln
- 604 Meadows Ct
- 99 E Ranchette Rd
- 177 E Ranchette Rd
- 150 E Ranchette Rd
- 138 E Ranchette Rd
- 168 E Ranchette Rd
- 180 E Ranchette Rd
- 51 Ryder Rd
- E E Ranchette Rd
- E E Ranchette Rd Unit 10
- 76 E Ranchette Rd
- 65 E Ranchette Rd
- 36 Ryder Rd
- 17 E Ranchette Rd
- 30 E Ranchette Rd
- 60 Miller Agan Rd
- 76 Ryder Rd
- 1407 Taylors Gin Rd
- 1309 Taylors Gin Rd
- 1367 Taylors Gin Rd
- 1327 Taylors Gin Rd
Your Personal Tour Guide
Ask me questions while you tour the home.