Estimated Value: $177,000 - $246,000
4
Beds
2
Baths
2,100
Sq Ft
$102/Sq Ft
Est. Value
About This Home
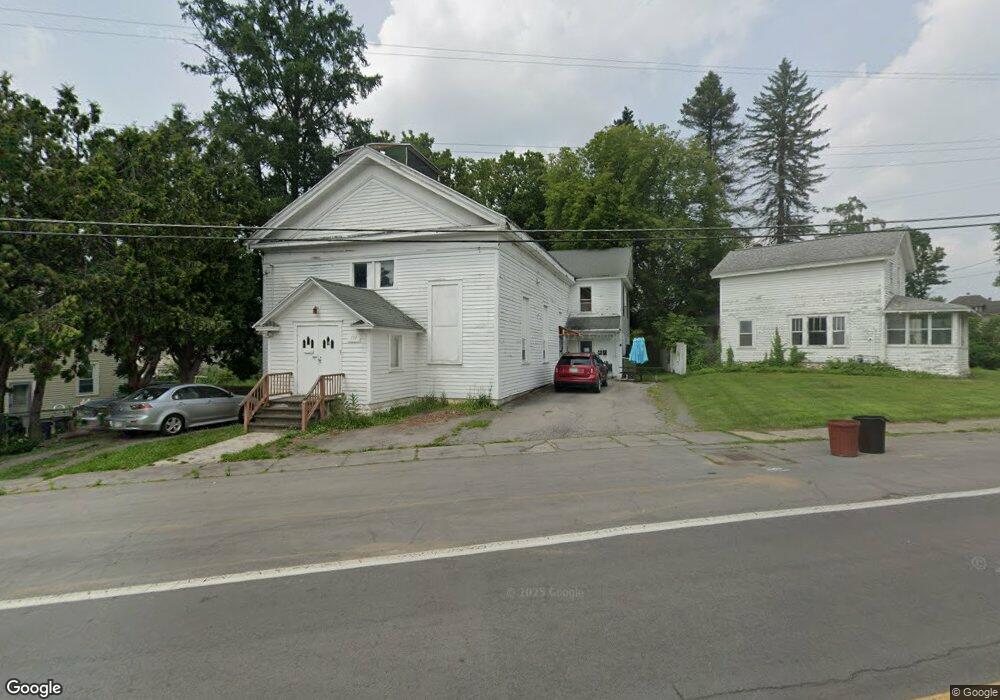
This home is located at 139 East Ave, Minoa, NY 13116 and is currently estimated at $213,541, approximately $101 per square foot. 139 East Ave is a home located in Onondaga County with nearby schools including Minoa Elementary School, Pine Grove Middle School, and East Syracuse Minoa Central High School.
Ownership History
Date
Name
Owned For
Owner Type
Purchase Details
Closed on
Feb 8, 2015
Sold by
Senke David
Bought by
Gonzalez Rene
Current Estimated Value
Home Financials for this Owner
Home Financials are based on the most recent Mortgage that was taken out on this home.
Original Mortgage
$69,850
Outstanding Balance
$53,716
Interest Rate
3.87%
Mortgage Type
FHA
Estimated Equity
$159,825
Purchase Details
Closed on
Sep 10, 2010
Sold by
Our Rental Homes Llc
Bought by
Senke David and Senke Katherine
Purchase Details
Closed on
Dec 15, 2009
Sold by
Head To Wind Llc Series 12
Bought by
Our Rental Homes Llc Series
Purchase Details
Closed on
Mar 18, 2006
Sold by
Leblanc Patrick
Bought by
Head To Wind Llc Series 12
Purchase Details
Closed on
Jan 31, 2006
Sold by
Federal National Mortgage Association
Bought by
Leblanc Patrick
Purchase Details
Closed on
Mar 4, 2005
Sold by
Apraez Manuel
Bought by
Federal National Mortgage Association
Create a Home Valuation Report for This Property
The Home Valuation Report is an in-depth analysis detailing your home's value as well as a comparison with similar homes in the area
Home Values in the Area
Average Home Value in this Area
Purchase History
| Date | Buyer | Sale Price | Title Company |
|---|---|---|---|
| Gonzalez Rene | $72,500 | Robert Carter | |
| Senke David | $22,000 | Joseph Lupia | |
| Our Rental Homes Llc Series | $50,000 | -- | |
| Head To Wind Llc Series 12 | -- | -- | |
| Leblanc Patrick | $25,000 | -- | |
| Federal National Mortgage Association | $52,899 | -- |
Source: Public Records
Mortgage History
| Date | Status | Borrower | Loan Amount |
|---|---|---|---|
| Open | Gonzalez Rene | $69,850 |
Source: Public Records
Tax History Compared to Growth
Tax History
| Year | Tax Paid | Tax Assessment Tax Assessment Total Assessment is a certain percentage of the fair market value that is determined by local assessors to be the total taxable value of land and additions on the property. | Land | Improvement |
|---|---|---|---|---|
| 2024 | $6,064 | $162,700 | $33,700 | $129,000 |
| 2023 | $6,016 | $144,800 | $30,000 | $114,800 |
| 2022 | $3,295 | $83,800 | $26,400 | $57,400 |
| 2021 | $3,219 | $75,500 | $25,400 | $50,100 |
| 2020 | $3,188 | $75,500 | $18,800 | $56,700 |
| 2019 | $595 | $71,500 | $17,800 | $53,700 |
| 2018 | $2,875 | $66,800 | $17,800 | $49,000 |
| 2017 | $518 | $61,400 | $17,800 | $43,600 |
| 2016 | $2,505 | $57,800 | $17,800 | $40,000 |
| 2015 | -- | $57,800 | $17,800 | $40,000 |
| 2014 | -- | $55,000 | $17,800 | $37,200 |
Source: Public Records
Map
Nearby Homes
- 132 Osborne St
- 309 N Main St
- 216 Fay Ln
- 129 S Central Ave
- 13 (Lot 155) Clairborn Ct
- 117 Colchester Rd
- 210 Ruth St
- 402 Ferndale Ln
- 93 Ripplebrook Ln
- 419 Fay Ln
- 101 Whiskwood Ln
- 103 Lake Forest Dr
- 105 Lake Forest Dr
- 89 Windebank Ln
- 203 Windebank Ln
- 211 Windebank Ln
- 11 (Lot 155) Clairborn Ct
- 157 Clairborn Ct
- 12 Clairborn (Lot 162) Ct
- 0000 Richmond Rd E