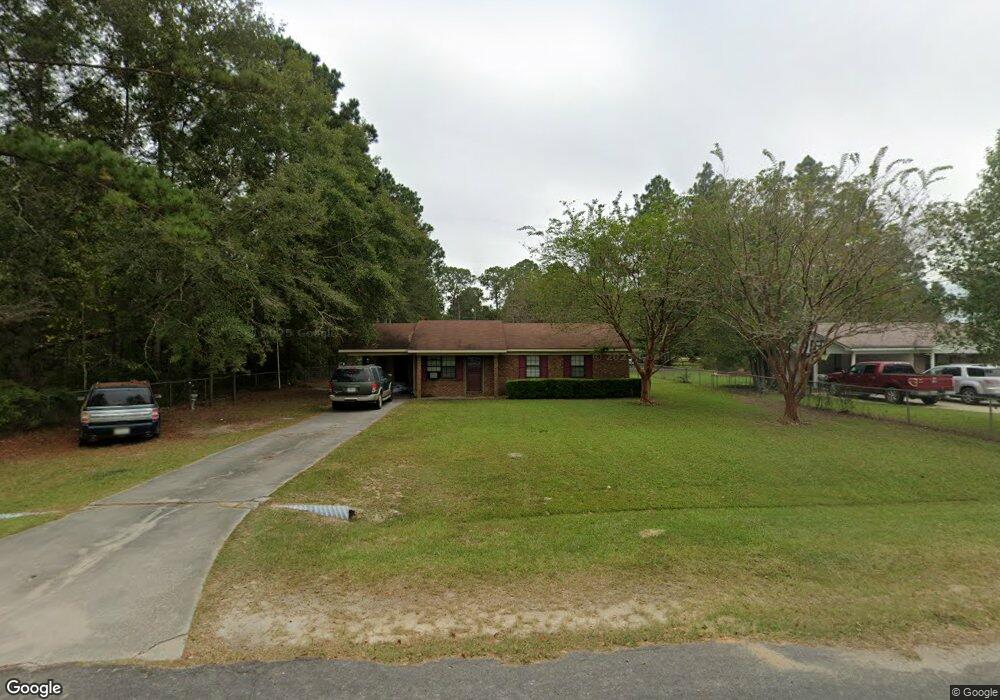
139 Educational Dr Hazlehurst, GA 31539
Estimated Value: $184,000 - $254,647
3
Beds
2
Baths
1,102
Sq Ft
$209/Sq Ft
Est. Value
About This Home
This home is located at 139 Educational Dr, Hazlehurst, GA 31539 and is currently estimated at $230,412, approximately $209 per square foot. 139 Educational Dr is a home located in Jeff Davis County with nearby schools including Jeff Davis Primary School, Jeff Davis Elementary School, and Jeff Davis Middle School.
Ownership History
Date
Name
Owned For
Owner Type
Purchase Details
Closed on
Sep 10, 2018
Sold by
Harrellson Chelsea Brianna
Bought by
Bohannon Johnathan Brodie
Current Estimated Value
Purchase Details
Closed on
Sep 11, 2015
Sold by
Bohannon David W
Bought by
Harrellson Chelsea Brianna and Bohannon Johnathan Brodie
Purchase Details
Closed on
Nov 7, 2014
Sold by
Stafford Brenda K
Bought by
Bohannon David W
Purchase Details
Closed on
Feb 2, 1990
Bought by
Bohannon David W
Purchase Details
Closed on
Sep 15, 1989
Bought by
Ursrey & Company
Purchase Details
Closed on
Jan 1, 1981
Bought by
Love Richard K & Iris
Create a Home Valuation Report for This Property
The Home Valuation Report is an in-depth analysis detailing your home's value as well as a comparison with similar homes in the area
Home Values in the Area
Average Home Value in this Area
Purchase History
| Date | Buyer | Sale Price | Title Company |
|---|---|---|---|
| Bohannon Johnathan Brodie | -- | -- | |
| Harrellson Chelsea Brianna | -- | -- | |
| Bohannon David W | -- | -- | |
| Bohannon David W | $40,600 | -- | |
| Ursrey & Company | $3,500 | -- | |
| Love Richard K & Iris | $4,000 | -- |
Source: Public Records
Tax History Compared to Growth
Tax History
| Year | Tax Paid | Tax Assessment Tax Assessment Total Assessment is a certain percentage of the fair market value that is determined by local assessors to be the total taxable value of land and additions on the property. | Land | Improvement |
|---|---|---|---|---|
| 2024 | $1,414 | $37,840 | $3,200 | $34,640 |
| 2023 | $962 | $25,731 | $3,200 | $22,531 |
| 2022 | $962 | $25,731 | $3,200 | $22,531 |
| 2021 | $962 | $25,731 | $3,200 | $22,531 |
| 2020 | $962 | $25,731 | $3,200 | $22,531 |
| 2019 | $962 | $25,731 | $3,200 | $22,531 |
| 2018 | $962 | $25,731 | $3,200 | $22,531 |
| 2017 | $663 | $22,955 | $2,234 | $20,721 |
| 2016 | $663 | $23,356 | $2,234 | $21,122 |
| 2015 | -- | $23,355 | $2,234 | $21,122 |
| 2014 | -- | $23,378 | $2,234 | $21,145 |
Source: Public Records
Map
Nearby Homes
- 0 Collins St
- 102 W Palm Rd
- 00 Pat Dixon St & Charles Rogers Blvd
- 0 Charles Rogers Blvd
- 393 Douglas Hwy
- 16 Beech Rd
- 54 Walton Way
- 44 Kersey St
- 45 Elton St
- 9 Kersey St
- 42 Claxton Rd
- 73 Latimer St
- 116 Walton Way
- 27 Park Ln
- 371 Burketts Ferry Rd
- 4 Lakeside Dr
- 20 W Sycamore St
- 6 Lynnwood Dr
- 39 N Tallahassee St
- 19 Martin Luther King jr Blvd
- 143 Educational Dr
- 147 Educational Dr
- 210 W Jefferson St
- 204 W Jefferson St
- 218 W Jefferson St
- 198 W Jefferson St
- 182 W Jefferson St
- 176 W Jefferson St
- 181 W Jefferson St
- 175 W Jefferson St
- 168 W Jefferson St
- 63 Pineland Ave
- 66 Pineland Ave
- 171 W Jefferson St
- 74 Leslie Rd
- 55 Pineland Ave
- 66 Douglas St
- 60 Douglas St
- 263 Broxton Hwy
- 68 Leslie Rd