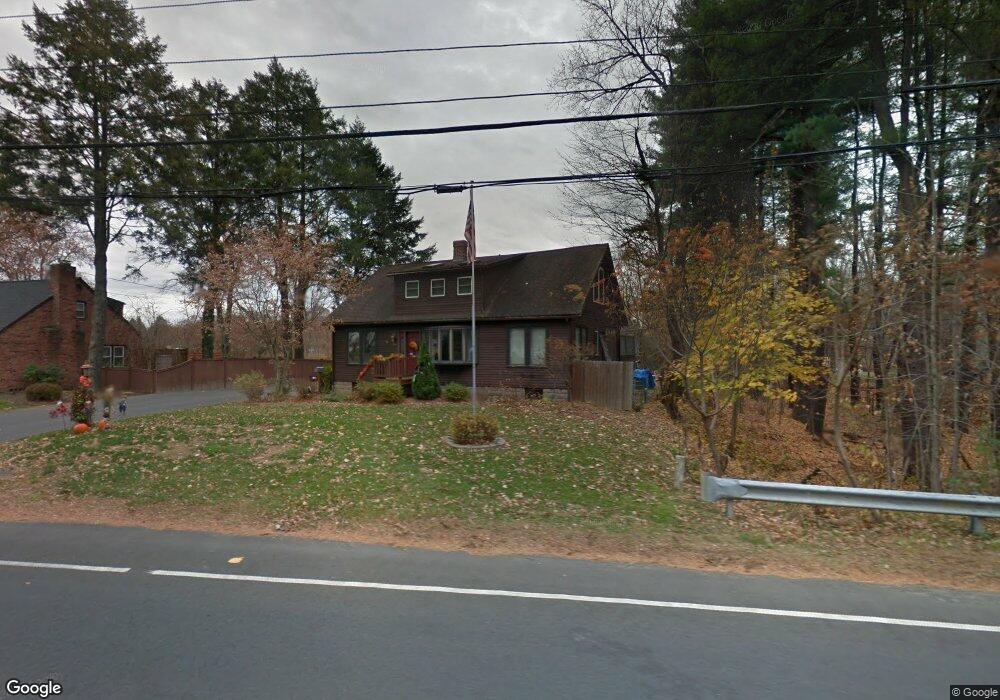
139 Elm St Agawam, MA 01001
Estimated Value: $365,000 - $585,000
4
Beds
2
Baths
1,800
Sq Ft
$254/Sq Ft
Est. Value
About This Home
This home is located at 139 Elm St, Agawam, MA 01001 and is currently estimated at $457,702, approximately $254 per square foot. 139 Elm St is a home located in Hampden County with nearby schools including Agawam Junior High School and Agawam High School.
Ownership History
Date
Name
Owned For
Owner Type
Purchase Details
Closed on
Mar 12, 2010
Sold by
Circosta Anthony and Circosta Danielle
Bought by
Chechile Brian M
Current Estimated Value
Home Financials for this Owner
Home Financials are based on the most recent Mortgage that was taken out on this home.
Original Mortgage
$194,400
Outstanding Balance
$129,102
Interest Rate
5.02%
Mortgage Type
Purchase Money Mortgage
Estimated Equity
$328,600
Purchase Details
Closed on
Apr 30, 2003
Sold by
Magistri Heather L and Rising Heather
Bought by
Circosta Anthony and Curley Danielle
Home Financials for this Owner
Home Financials are based on the most recent Mortgage that was taken out on this home.
Original Mortgage
$202,350
Interest Rate
5.82%
Mortgage Type
Purchase Money Mortgage
Purchase Details
Closed on
Oct 15, 1999
Sold by
Lyne Andrew S and Lyne Joanne P
Bought by
Rising Shawn D and Magistryi Heather L
Home Financials for this Owner
Home Financials are based on the most recent Mortgage that was taken out on this home.
Original Mortgage
$160,817
Interest Rate
7.8%
Mortgage Type
Purchase Money Mortgage
Purchase Details
Closed on
Apr 26, 1996
Sold by
Ferracci Daniel J and Ferracci Karyn E
Bought by
Lyne Andrew S and Lyne Joanne P
Purchase Details
Closed on
Apr 27, 1993
Sold by
Keeley Brian S and Keeley Lori A
Bought by
Ferracci Daniel J and Ferracci Karyn E
Create a Home Valuation Report for This Property
The Home Valuation Report is an in-depth analysis detailing your home's value as well as a comparison with similar homes in the area
Home Values in the Area
Average Home Value in this Area
Purchase History
| Date | Buyer | Sale Price | Title Company |
|---|---|---|---|
| Chechile Brian M | $243,000 | -- | |
| Circosta Anthony | $213,000 | -- | |
| Rising Shawn D | $160,900 | -- | |
| Lyne Andrew S | $133,000 | -- | |
| Ferracci Daniel J | $141,500 | -- |
Source: Public Records
Mortgage History
| Date | Status | Borrower | Loan Amount |
|---|---|---|---|
| Open | Chechile Brian M | $194,400 | |
| Previous Owner | Circosta Anthony | $202,350 | |
| Previous Owner | Ferracci Daniel J | $160,787 | |
| Previous Owner | Ferracci Daniel J | $160,817 |
Source: Public Records
Tax History Compared to Growth
Tax History
| Year | Tax Paid | Tax Assessment Tax Assessment Total Assessment is a certain percentage of the fair market value that is determined by local assessors to be the total taxable value of land and additions on the property. | Land | Improvement |
|---|---|---|---|---|
| 2025 | $5,218 | $356,400 | $127,300 | $229,100 |
| 2024 | $5,063 | $348,200 | $127,300 | $220,900 |
| 2023 | $4,857 | $307,800 | $115,100 | $192,700 |
| 2022 | $4,485 | $278,400 | $115,100 | $163,300 |
| 2021 | $4,319 | $257,100 | $102,200 | $154,900 |
| 2020 | $4,199 | $249,500 | $100,600 | $148,900 |
| 2019 | $4,016 | $241,200 | $98,500 | $142,700 |
| 2018 | $3,739 | $225,100 | $92,600 | $132,500 |
| 2017 | $3,549 | $217,600 | $92,600 | $125,000 |
| 2016 | $3,501 | $216,400 | $92,600 | $123,800 |
| 2015 | $3,331 | $211,600 | $92,600 | $119,000 |
Source: Public Records
Map
Nearby Homes
- 4H Mapleviewlane Unit 4H
- 0 Silver St
- 869-871 Main St
- 4 H Castle Hills Rd Unit H
- 1 Castle Hill Rd Unit D
- 64 Woodside Dr
- 25 Castle Hill Rd Unit E
- 15 B Castle Hills Rd Unit B
- 20 Castle Hill Rd Unit D
- 15 Bailey St
- 6 Mansion Woods Dr Unit A
- 52 Peros Dr
- 73 Silver Lake Dr
- 49 Hearthstone Dr
- 144 Mallard Cir
- 42 Lakeview Cir
- 83 Fairview St
- 111 Cottonwood Ln
- 420 Main St Unit 82
- 420 Main St Unit 71