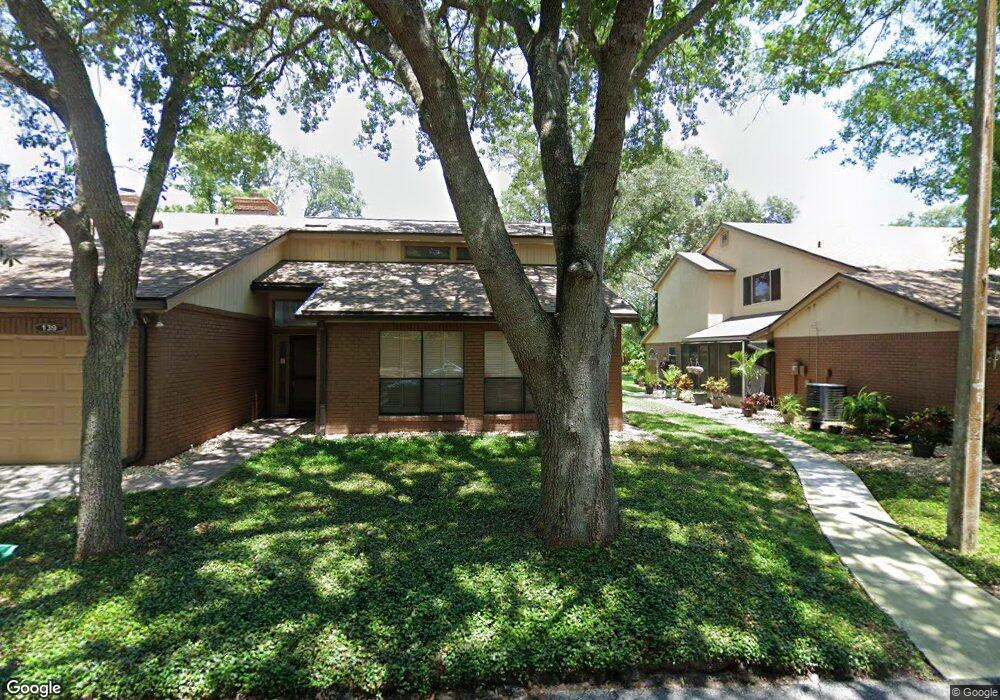
139 Feather Edge Loop Unit 9D Lake Mary, FL 32746
Estimated Value: $319,000 - $385,000
3
Beds
3
Baths
2,287
Sq Ft
$148/Sq Ft
Est. Value
About This Home
This home is located at 139 Feather Edge Loop Unit 9D, Lake Mary, FL 32746 and is currently estimated at $338,127, approximately $147 per square foot. 139 Feather Edge Loop Unit 9D is a home located in Seminole County with nearby schools including Crystal Lake Elementary School, Wicklow Elementary School, and Seminole High School.
Ownership History
Date
Name
Owned For
Owner Type
Purchase Details
Closed on
Mar 27, 2012
Sold by
Federal National Mortgage Association
Bought by
Zhu Hai Bo
Current Estimated Value
Purchase Details
Closed on
Jan 11, 2012
Sold by
Nationstar Mortgage Llc
Bought by
Federal National Mortgage Association
Purchase Details
Closed on
Jan 1, 2012
Bought by
Zhu Hai Bo
Purchase Details
Closed on
Nov 10, 2011
Sold by
Alsabrook Cindy
Bought by
Nationstar Mortgage Llc
Purchase Details
Closed on
Jul 19, 2005
Sold by
Murphy Diane and Davis Diane
Bought by
Alsabrook Cindy
Home Financials for this Owner
Home Financials are based on the most recent Mortgage that was taken out on this home.
Original Mortgage
$187,000
Interest Rate
5.46%
Mortgage Type
Fannie Mae Freddie Mac
Purchase Details
Closed on
Oct 1, 1986
Bought by
Zhu Hai Bo
Create a Home Valuation Report for This Property
The Home Valuation Report is an in-depth analysis detailing your home's value as well as a comparison with similar homes in the area
Home Values in the Area
Average Home Value in this Area
Purchase History
| Date | Buyer | Sale Price | Title Company |
|---|---|---|---|
| Zhu Hai Bo | $106,500 | Attorney | |
| Federal National Mortgage Association | -- | Watson Title Company Inc | |
| Zhu Hai Bo | $100 | -- | |
| Nationstar Mortgage Llc | $66,100 | None Available | |
| Alsabrook Cindy | $210,000 | -- | |
| Zhu Hai Bo | $96,800 | -- |
Source: Public Records
Mortgage History
| Date | Status | Borrower | Loan Amount |
|---|---|---|---|
| Previous Owner | Alsabrook Cindy | $187,000 |
Source: Public Records
Tax History Compared to Growth
Tax History
| Year | Tax Paid | Tax Assessment Tax Assessment Total Assessment is a certain percentage of the fair market value that is determined by local assessors to be the total taxable value of land and additions on the property. | Land | Improvement |
|---|---|---|---|---|
| 2024 | $3,957 | $282,534 | -- | -- |
| 2023 | $3,672 | $256,849 | $0 | $0 |
| 2021 | $3,080 | $212,272 | $0 | $212,272 |
| 2020 | $2,919 | $199,576 | $0 | $0 |
| 2019 | $2,891 | $199,576 | $0 | $0 |
| 2018 | $2,618 | $174,112 | $0 | $0 |
| 2017 | $2,634 | $170,575 | $0 | $0 |
| 2016 | $2,529 | $155,068 | $0 | $0 |
| 2015 | $2,252 | $155,068 | $0 | $0 |
| 2014 | $2,252 | $142,372 | $0 | $0 |
Source: Public Records
Map
Nearby Homes
- 603 W Club Blvd
- 1272 Patterson Terrace
- 1268 Patterson Terrace
- 203 N Forest Blvd
- 1314 Patterson Terrace
- 4297 Regal Town Ln
- 928 Lobelia Dr
- 236 Peppertree Ct
- 524 Lobelia Dr
- 112 E Plantation Blvd
- 114 E Plantation Blvd
- 1704 Lobelia Dr
- 936 Birmingham Ct Unit 206
- 2408 Lobelia Dr
- 5405 Napoli Cove
- 4401 Messina Dr
- 2444 Lobelia Dr
- 3433 Messina Dr
- 4200 Messina Dr
- 4244 Messina Dr
- 139 Feather Edge Loop Unit 139
- 137 Feather Edge Loop
- 137 Feather Edge Loop Unit n/a
- 137 Feather Edge Loop Unit 9C
- 141 Feather Edge Loop Unit 11A
- 135 Feather Edge Loop
- 143 Feather Edge Loop Unit 11B
- 143 Feather Edge Loop
- 133 Feather Edge Loop
- 109 Carli Ct
- 145 Feather Edge Loop
- 107 Carli Ct
- 107 Carli Ct
- 147 Feather Edge Loop Unit B
- 105 Carli Ct Unit 3C
- 125 Feather Edge Loop Unit 10A
- 131 Feather Edge Loop Unit 10D
- 127 Feather Edge Loop Unit 10B
- 129 Feather Edge Loop
- 129 Feather Edge Loop Unit 129