

UNDER CONTRACT
$71K PRICE DROP
139 Finlay St Staten Island, NY 10307
Tottenville NeighborhoodEstimated payment $7,867/month
Total Views
74,583
4
Beds
2.5
Baths
3,500
Sq Ft
$371
Price per Sq Ft
Highlights
- Hot Property
- In Ground Pool
- Separate Formal Living Room
- P.S. 1 Tottenville Rated A-
- Colonial Architecture
- No HOA
About This Home
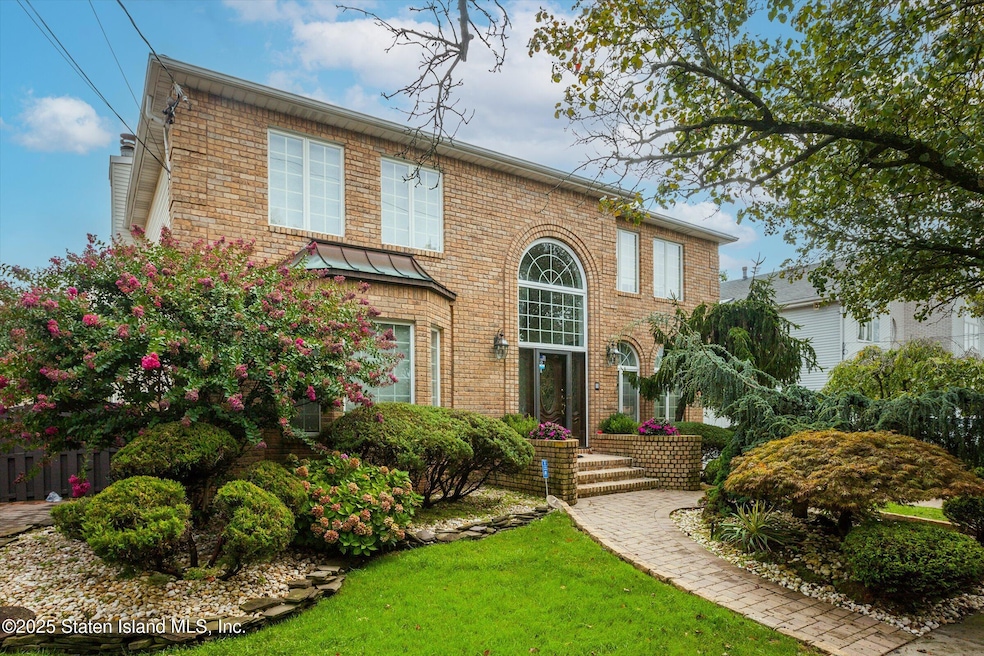
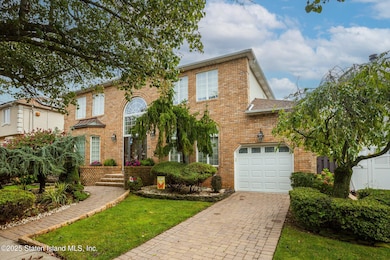
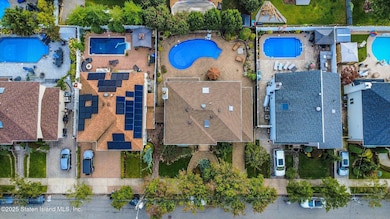
Welcome to this stunning brick-faced Center Hall Colonial located in the highly desirable Tottenville section of Staten Island. Perfectly situated on a quiet dead-end street, this expansive residence offers over 3,500 square feet of elegant living space, blending timeless architecture with modern luxury.
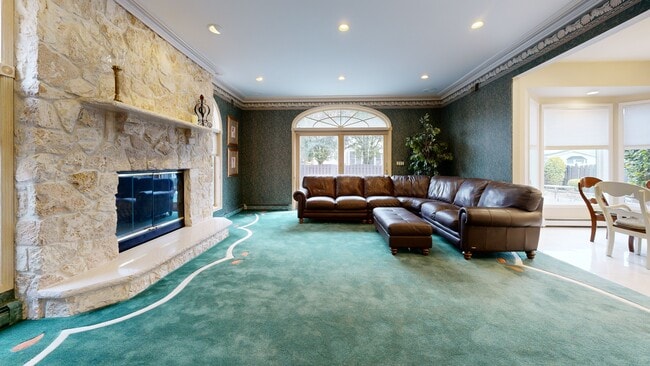
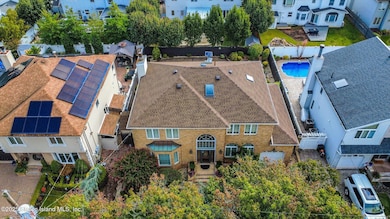
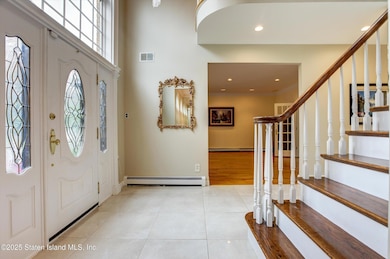
Upon entering, you're greeted by an impressive foyer that immediately sets the tone for the home's grandeur. The main level showcases an inviting and spacious formal living room and dining room—ideal for entertaining or hosting gatherings. The fully updated chef's kitchen is a true highlight, featuring high-end cabinetry, sleek stainless steel appliances, and exquisite granite countertops. The kitchen flows seamlessly into an oversized family room adorned with a beautiful fireplace, creating the perfect setting for comfort and connection. A stylish half bath completes the main level. Upstairs, you'll find four generously sized bedrooms offering both space and serenity. The primary suite is a true retreat, featuring a private en suite bathroom and ample closet space. The second floor is enhanced by three skylights—two of which are thoughtfully placed in the bathrooms—filling the home with natural light. Additional features include a central vacuum system, an alarm system providing peace of mind, and an unfinished basement that serves as an open canvas to create even more living space to suit your lifestyle. Step outside to your own private oasis—an expansive backyard designed for relaxation and entertainment. The beautifully paved patio surrounds a stunning saltwater in-ground pool, perfect for summer gatherings and quiet evenings alike. Located in one of Staten Island's most sought-after neighborhoods, this exceptional home offers the perfect balance of sophistication, comfort, and convenience—close to top-rated schools, scenic parks, and all major transportation. A true Tottenville gem, this home is the perfect blend of elegance and everyday living.
Home Details
Home Type
- Single Family
Est. Annual Taxes
- $12,327
Year Built
- Built in 1993
Lot Details
- 6,305 Sq Ft Lot
- Lot Dimensions are 65 x 97
- Fenced
- Back Yard
- Property is zoned R3-X
Parking
- 1 Car Attached Garage
- Garage Door Opener
- On-Street Parking
- Off-Street Parking
Home Design
- Colonial Architecture
- Brick Exterior Construction
- Vinyl Siding
Interior Spaces
- 3,500 Sq Ft Home
- 2-Story Property
- Fireplace
- Separate Formal Living Room
- Formal Dining Room
- Basement
Kitchen
- Eat-In Kitchen
- Microwave
- Dishwasher
Bedrooms and Bathrooms
- 4 Bedrooms
- Walk-In Closet
Laundry
- Dryer
- Washer
Outdoor Features
- In Ground Pool
- Patio
- Shed
- Outdoor Gas Grill
Utilities
- Cooling Available
- Heating System Uses Natural Gas
- Hot Water Baseboard Heater
- 220 Volts
Community Details
- No Home Owners Association
Listing and Financial Details
- Legal Lot and Block 69 / 07927
- Assessor Parcel Number 07927-69
Matterport 3D Tour
Floorplans
Map
Create a Home Valuation Report for This Property
The Home Valuation Report is an in-depth analysis detailing your home's value as well as a comparison with similar homes in the area
Home Values in the Area
Average Home Value in this Area
Tax History
| Year | Tax Paid | Tax Assessment Tax Assessment Total Assessment is a certain percentage of the fair market value that is determined by local assessors to be the total taxable value of land and additions on the property. | Land | Improvement |
|---|---|---|---|---|
| 2025 | $12,922 | $77,160 | $13,554 | $63,606 |
| 2024 | $12,922 | $70,200 | $14,407 | $55,793 |
| 2023 | $12,327 | $60,696 | $11,582 | $49,114 |
| 2022 | $11,731 | $74,100 | $15,720 | $58,380 |
| 2021 | $11,667 | $70,380 | $15,720 | $54,660 |
| 2020 | $11,735 | $69,780 | $15,720 | $54,060 |
| 2019 | $11,216 | $71,160 | $15,720 | $55,440 |
| 2018 | $10,311 | $50,580 | $15,720 | $34,860 |
| 2017 | $9,983 | $48,972 | $14,240 | $34,732 |
| 2016 | $9,236 | $46,200 | $15,720 | $30,480 |
| 2015 | $9,033 | $50,760 | $13,080 | $37,680 |
| 2014 | $9,033 | $48,660 | $12,539 | $36,121 |
Source: Public Records
Property History
| Date | Event | Price | List to Sale | Price per Sq Ft |
|---|---|---|---|---|
| 11/05/2025 11/05/25 | Price Changed | $1,299,000 | -5.2% | $371 / Sq Ft |
| 10/22/2025 10/22/25 | For Sale | $1,369,999 | -- | $391 / Sq Ft |
Source: Staten Island Multiple Listing Service
Purchase History
| Date | Type | Sale Price | Title Company |
|---|---|---|---|
| Quit Claim Deed | -- | None Listed On Document | |
| Interfamily Deed Transfer | -- | None Available | |
| Bargain Sale Deed | $630,000 | First American Title Ins Co |
Source: Public Records
Mortgage History
| Date | Status | Loan Amount | Loan Type |
|---|---|---|---|
| Previous Owner | $175,000 | No Value Available |
Source: Public Records
About the Listing Agent
John's Other Listings
-
$439,000 Under Contract
- 2 Beds
- 2.5 Baths
- 1,457 Sq Ft
- 3 Dancaster Ct
- Unit 3303
- Sayreville, NJ
Highest and best due Tuesday 10/21 at 12PM. Welcome to this stunning and meticulously maintained condo located in the highly desirable Sheffield Mews community in Sayreville, New Jersey. This beautiful home offers 2 spacious bedrooms and 2.5 bathrooms, combining style, comfort, and functionality. The main level features a bright and inviting living room and a formal dining room, both adorned with
John DeStefano RE/MAX FIRST REALTY, INC.
-
$315,000 Under Contract
- 2 Beds
- 1 Bath
- 914 Sq Ft
- 56 Galewood Dr
- Unit A
- Matawan, NJ
Welcome to Cheesequake Village, an active 55+ community offering comfort, convenience, and style! This beautifully remodeled 2-bedroom, 1-bath first-floor end unit perfectly blends modern upgrades with low-maintenance living. Enter to find stunning laminate flooring that flows seamlessly throughout the home. The spacious living room provides the perfect space to relax or entertain, while the
John DeStefano RE/MAX FIRST REALTY, INC.
-
$599,000
- 4 Beds
- 2 Baths
- 1,589 Sq Ft
- 22 Mansfield Ave
- East Brunswick, NJ
Welcome to your next East Brunswick geman impeccably maintained and fully modernized 4-bedroom, 2-bath Cape Cod that blends timeless charm with today's most sought-after upgrades. From the moment you enter, you're greeted by a bright and spacious living room adorned with stunning laminate floors, recessed lighting, and a sleek electric fireplace that sets the perfect ambiance for both everyday
John DeStefano RE/MAX FIRST REALTY, INC.
-
$409,000 Under Contract
- 4 Beds
- 2 Baths
- 1,512 Sq Ft
- 41 New St
- Spotswood, NJ
Welcome to this exciting investor opportunity located in the desirable town of Spotswood, NJ! This 4-bedroom, 2-bathroom home offers tremendous potential for the right buyer looking to restore and reimagine a property with great bones. Situated on a large, spacious lot, this home provides ample outdoor spaceperfect for creating the ideal backyard retreat, expanding the living area, or adding
John DeStefano RE/MAX FIRST REALTY, INC.
Source: Staten Island Multiple Listing Service
MLS Number: 2506241
APN: 07927-0069
Disclaimer: Certain information contained herein is derived from information provided by parties other than Homes.com. All information provided is deemed reliable, but is not guaranteed to be accurate and should be independently verified.
![]() Certain real estate listing data is provided by Staten Island MLS under its Internet Data Exchange program. This data is provided exclusively for consumers’ personal, non-commercial use and may only be used for identifying prospective properties consumers may be interested in purchasing or renting. Any other use of the data is hereby prohibited. Data deemed reliable but is not guaranteed accurate by Staten Island MLS and should be independently verified. Copyright 2025 Staten Island Multiple Listing Service, Inc. All rights reserved.
Certain real estate listing data is provided by Staten Island MLS under its Internet Data Exchange program. This data is provided exclusively for consumers’ personal, non-commercial use and may only be used for identifying prospective properties consumers may be interested in purchasing or renting. Any other use of the data is hereby prohibited. Data deemed reliable but is not guaranteed accurate by Staten Island MLS and should be independently verified. Copyright 2025 Staten Island Multiple Listing Service, Inc. All rights reserved.
Nearby Homes
- 9 Massachusetts St
- 159 Aspinwall St
- 197 Finlay St
- 153 Carteret St
- 197 Aspinwall St
- 73 Aspinwall St
- 11 Satterlee St
- 284 Chelsea St
- 162 Bentley St
- 146 Bentley St
- 7546 Amboy Rd
- 40 Brighton St
- 342 Chelsea St
- 2 Wards Point Ave
- 30 Aviva Ct
- 403 Yetman Ave
- 411 Yetman Ave
- 539 Yetman Ave
- 382 Manhattan St
- 329 George St
- 183 Brighton St Unit 1
- 148 Main St
- 137 Main St
- 5448 Arthur Kill Rd Unit 2nd Floor
- 410 Sprague Ave
- 265 Front St
- 295 Water St
- 358 Rector St Unit 705
- 18 Harbor Terrace
- 368 Rector St Unit 421
- 331 Rector St
- 400 High St
- 291 High St Unit 2
- 110 Rector St Unit 1
- 110 Rector St Unit 2
- 76 Market St
- 270 King St
- 110 Market St Unit 3E
- 109 Washington St Unit 2
- 44 High St