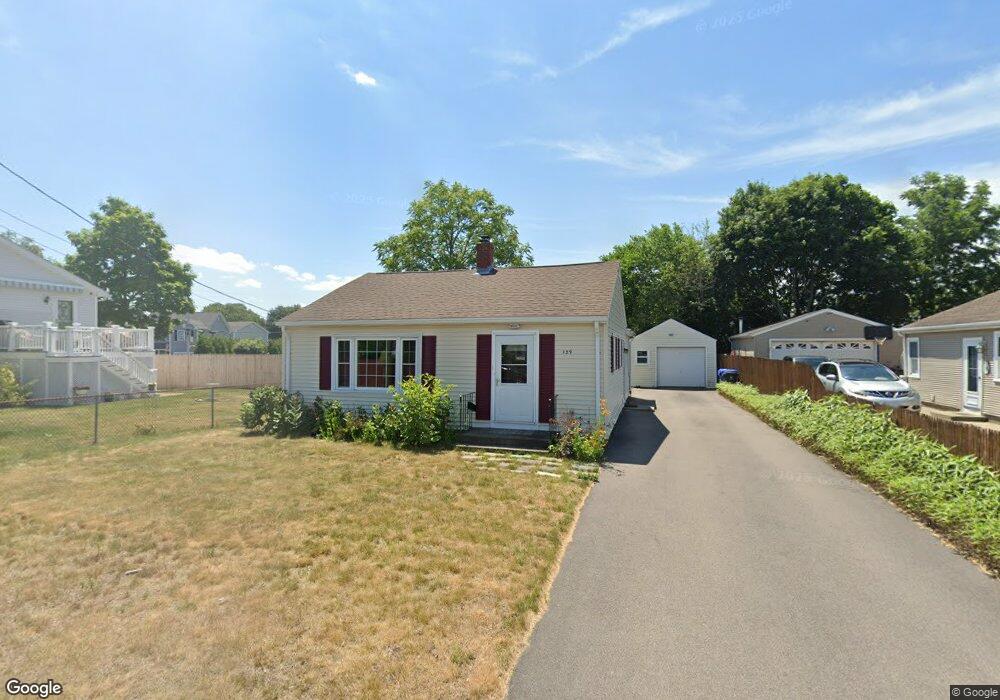
139 Flint St Pawtucket, RI 02861
Darlington NeighborhoodEstimated Value: $369,000 - $384,760
3
Beds
1
Bath
1,064
Sq Ft
$354/Sq Ft
Est. Value
About This Home
This home is located at 139 Flint St, Pawtucket, RI 02861 and is currently estimated at $376,440, approximately $353 per square foot. 139 Flint St is a home located in Providence County with nearby schools including St Cecilia School and Dayspring Christian Academy.
Ownership History
Date
Name
Owned For
Owner Type
Purchase Details
Closed on
May 22, 2019
Sold by
Wunschel Randy L and Kostka Kourtney J
Bought by
Kostka Kourtney J
Current Estimated Value
Home Financials for this Owner
Home Financials are based on the most recent Mortgage that was taken out on this home.
Original Mortgage
$70,000
Outstanding Balance
$27,897
Interest Rate
4.2%
Mortgage Type
New Conventional
Estimated Equity
$348,543
Purchase Details
Closed on
Jun 17, 2003
Sold by
Clegg John R and Kostka Maureen F
Bought by
Wunschel Randy L and Kostka Kourtney J
Home Financials for this Owner
Home Financials are based on the most recent Mortgage that was taken out on this home.
Original Mortgage
$112,500
Interest Rate
5.77%
Mortgage Type
Purchase Money Mortgage
Create a Home Valuation Report for This Property
The Home Valuation Report is an in-depth analysis detailing your home's value as well as a comparison with similar homes in the area
Home Values in the Area
Average Home Value in this Area
Purchase History
| Date | Buyer | Sale Price | Title Company |
|---|---|---|---|
| Kostka Kourtney J | -- | -- | |
| Wunschel Randy L | $31,500 | -- |
Source: Public Records
Mortgage History
| Date | Status | Borrower | Loan Amount |
|---|---|---|---|
| Open | Kostka Kourtney J | $70,000 | |
| Previous Owner | Wunschel Randy L | $54,533 | |
| Previous Owner | Wunschel Randy L | $112,500 |
Source: Public Records
Tax History Compared to Growth
Tax History
| Year | Tax Paid | Tax Assessment Tax Assessment Total Assessment is a certain percentage of the fair market value that is determined by local assessors to be the total taxable value of land and additions on the property. | Land | Improvement |
|---|---|---|---|---|
| 2025 | $4,290 | $326,200 | $156,200 | $170,000 |
| 2024 | $4,025 | $326,200 | $156,200 | $170,000 |
| 2023 | $3,673 | $216,800 | $71,500 | $145,300 |
| 2022 | $3,595 | $216,800 | $71,500 | $145,300 |
| 2021 | $3,595 | $216,800 | $71,500 | $145,300 |
| 2020 | $3,549 | $169,900 | $64,700 | $105,200 |
| 2019 | $3,549 | $169,900 | $64,700 | $105,200 |
| 2018 | $3,420 | $169,900 | $64,700 | $105,200 |
| 2017 | $2,994 | $131,800 | $50,400 | $81,400 |
| 2016 | $2,885 | $131,800 | $50,400 | $81,400 |
| 2015 | $2,885 | $131,800 | $50,400 | $81,400 |
| 2014 | $2,829 | $122,700 | $50,400 | $72,300 |
Source: Public Records
Map
Nearby Homes
- 50 Stearns St
- 44 Stanley St
- 207 Benefit St
- 179 Columbine Ave
- 19 Lodi St
- 97 Wendell St
- 37 Turner St
- 139 Tweed St
- 48 Pullman Ave
- 61 Mendon Rd
- 548 Kenyon Ave Unit 25
- 548 Kenyon Ave Unit 27
- 548 Kenyon Ave Unit 45
- 50 Pullman Ave Unit B
- 50 Pullman Ave Unit A
- 68 Slade St
- 39 Chaplin St
- 460 Collins St Unit 38
- 27 Aiken St
- 0 Chaplin St