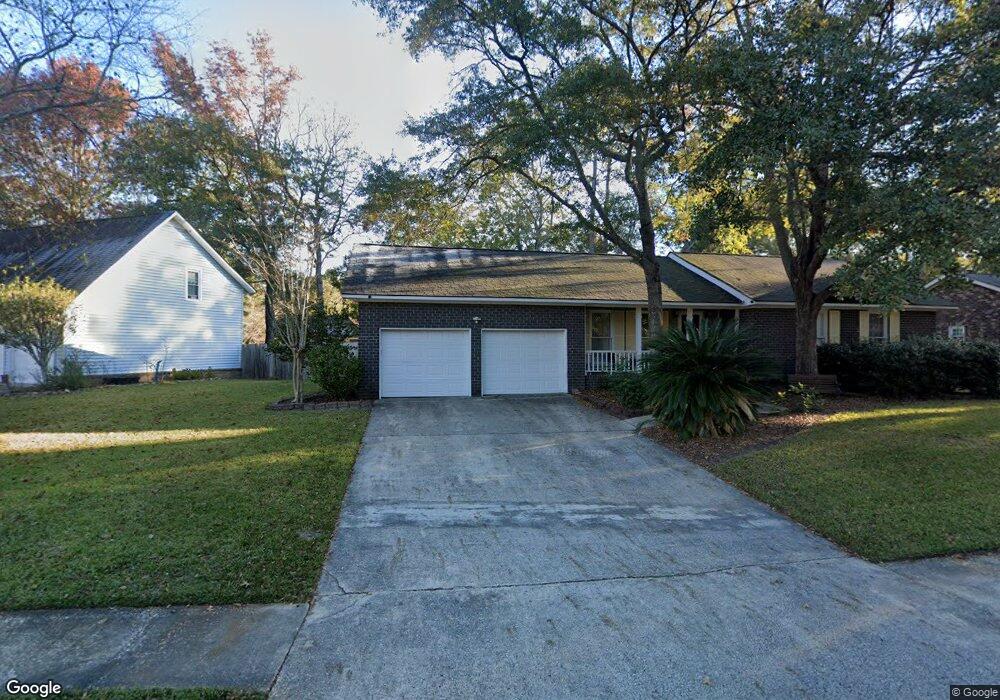
139 Fox Chase Dr Goose Creek, SC 29445
Estimated Value: $295,000 - $335,000
3
Beds
2
Baths
1,206
Sq Ft
$264/Sq Ft
Est. Value
About This Home
This home is located at 139 Fox Chase Dr, Goose Creek, SC 29445 and is currently estimated at $318,657, approximately $264 per square foot. 139 Fox Chase Dr is a home located in Berkeley County with nearby schools including Westview Primary School, Westview Elementary School, and Westview Middle School.
Ownership History
Date
Name
Owned For
Owner Type
Purchase Details
Closed on
Jan 22, 2013
Sold by
Ward Brian K and Ward Margaret E
Bought by
Ward Margaret E
Current Estimated Value
Purchase Details
Closed on
Aug 3, 2011
Sold by
Dawson Winfred Oscar
Bought by
Dawson Jeffrey Scott and The Living Trust Of Winfred Oscar Dawson
Purchase Details
Closed on
Feb 6, 2009
Sold by
Ward Margaret E
Bought by
Ward Brian and Ward Margaret E
Home Financials for this Owner
Home Financials are based on the most recent Mortgage that was taken out on this home.
Original Mortgage
$192,728
Outstanding Balance
$122,153
Interest Rate
5.15%
Mortgage Type
FHA
Estimated Equity
$196,504
Purchase Details
Closed on
Dec 14, 2007
Sold by
Quinn Margaret Elizabeth
Bought by
Ward Margaret E
Home Financials for this Owner
Home Financials are based on the most recent Mortgage that was taken out on this home.
Original Mortgage
$190,820
Interest Rate
6.21%
Mortgage Type
FHA
Purchase Details
Closed on
Mar 24, 2004
Sold by
Quinn James Scott
Bought by
Quinn Margaret Elizabeth
Create a Home Valuation Report for This Property
The Home Valuation Report is an in-depth analysis detailing your home's value as well as a comparison with similar homes in the area
Home Values in the Area
Average Home Value in this Area
Purchase History
| Date | Buyer | Sale Price | Title Company |
|---|---|---|---|
| Ward Margaret E | -- | -- | |
| Dawson Jeffrey Scott | -- | -- | |
| Ward Brian | -- | -- | |
| Ward Margaret E | -- | None Available | |
| Quinn Margaret Elizabeth | -- | -- |
Source: Public Records
Mortgage History
| Date | Status | Borrower | Loan Amount |
|---|---|---|---|
| Open | Ward Brian | $192,728 | |
| Closed | Ward Margaret E | $190,820 |
Source: Public Records
Tax History Compared to Growth
Tax History
| Year | Tax Paid | Tax Assessment Tax Assessment Total Assessment is a certain percentage of the fair market value that is determined by local assessors to be the total taxable value of land and additions on the property. | Land | Improvement |
|---|---|---|---|---|
| 2025 | $1,141 | $203,665 | $42,811 | $160,854 |
| 2024 | $1,141 | $8,146 | $1,712 | $6,434 |
| 2023 | $1,141 | $8,146 | $1,712 | $6,434 |
| 2022 | $1,121 | $7,084 | $1,688 | $5,396 |
| 2021 | $1,207 | $7,090 | $1,688 | $5,396 |
| 2020 | $1,154 | $7,084 | $1,688 | $5,396 |
| 2019 | $1,103 | $7,084 | $1,688 | $5,396 |
| 2018 | $1,005 | $6,160 | $1,400 | $4,760 |
| 2017 | $998 | $6,160 | $1,400 | $4,760 |
| 2016 | $1,005 | $6,160 | $1,400 | $4,760 |
| 2015 | $947 | $6,160 | $1,400 | $4,760 |
| 2014 | $892 | $6,160 | $1,400 | $4,760 |
| 2013 | -- | $6,160 | $1,400 | $4,760 |
Source: Public Records
Map
Nearby Homes
- 18 Rudwick Cir Unit 18
- 206 Alston Cir
- 112 Chownings Ln
- 103 Old Post Cir
- 201 Commons Way
- 108 Williamsburg Ct
- 135 Commons Way
- 18 Indigo Ln
- 113 Wessex Dr
- 100 Lexington Place
- 58 Indigo Ln
- 216 Holly Ave
- 100 Conset Bay Ct
- 102 Winding Rock Rd
- 203 Blenheim Ct
- 136 Harrow Place
- 105 Shelton Ln
- 407 Farm Rd
- 111 Prentice Cir
- 301 Farm Rd
- 137 Fox Chase Dr
- 141 Fox Chase Dr
- 103 Springfield Place
- 135 Fox Chase Dr
- 105 Springfield Place
- 128 Fox Chase Dr
- 143 Fox Chase Dr
- 130 Fox Chase Dr
- 101 Springfield Place
- 132 Fox Chase Dr
- 126 Fox Chase Dr
- 145 Fox Chase Dr
- 133 Fox Chase Dr
- 124 Chesapeake Ln
- 124 Fox Chase Dr
- 147 Fox Chase Dr
- 134 Fox Chase Dr
- 107 Springfield Place
- 115 Chesapeake Ln
- 131 Fox Chase Dr