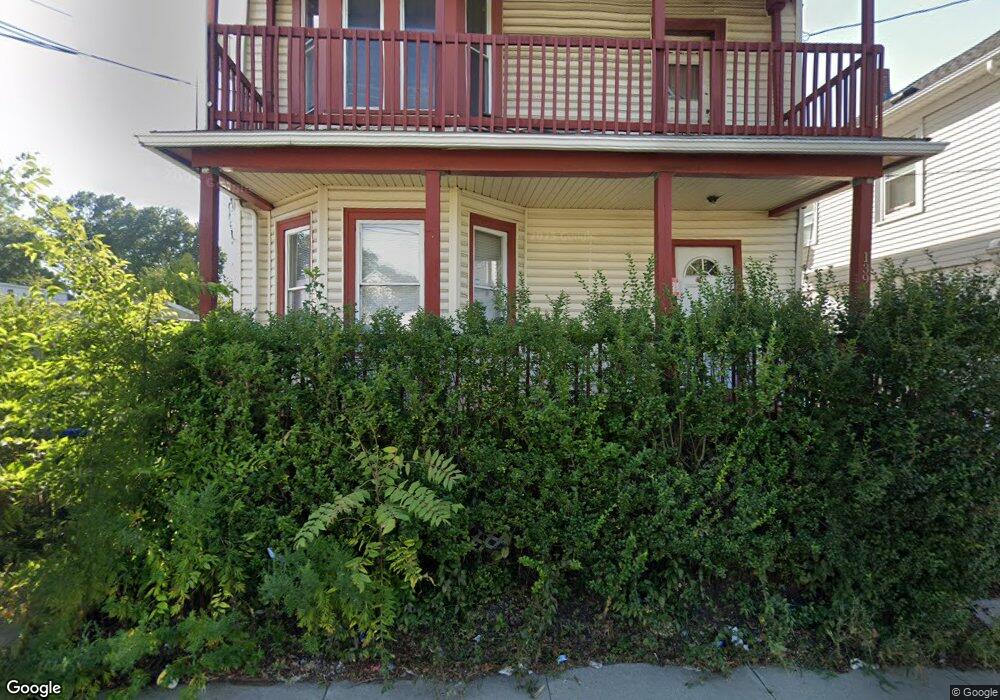
139 Glenbridge Ave Providence, RI 02909
Hartford NeighborhoodEstimated Value: $409,723 - $517,000
4
Beds
2
Baths
1,992
Sq Ft
$231/Sq Ft
Est. Value
About This Home
This home is located at 139 Glenbridge Ave, Providence, RI 02909 and is currently estimated at $460,931, approximately $231 per square foot. 139 Glenbridge Ave is a home located in Providence County with nearby schools including Achievement First Promesa, Achievement First Providence Mayoral Academy Elementary School, and Achievement First Providence Mayoral Academy Elementary.
Ownership History
Date
Name
Owned For
Owner Type
Purchase Details
Closed on
Apr 7, 1997
Sold by
Patrick Eileen L
Bought by
Caldaron Freddy W
Current Estimated Value
Home Financials for this Owner
Home Financials are based on the most recent Mortgage that was taken out on this home.
Original Mortgage
$75,000
Interest Rate
7.5%
Mortgage Type
Purchase Money Mortgage
Create a Home Valuation Report for This Property
The Home Valuation Report is an in-depth analysis detailing your home's value as well as a comparison with similar homes in the area
Home Values in the Area
Average Home Value in this Area
Purchase History
| Date | Buyer | Sale Price | Title Company |
|---|---|---|---|
| Caldaron Freddy W | $71,000 | -- |
Source: Public Records
Mortgage History
| Date | Status | Borrower | Loan Amount |
|---|---|---|---|
| Open | Caldaron Freddy W | $99,000 | |
| Open | Caldaron Freddy W | $156,000 | |
| Closed | Caldaron Freddy W | $75,000 |
Source: Public Records
Tax History
| Year | Tax Paid | Tax Assessment Tax Assessment Total Assessment is a certain percentage of the fair market value that is determined by local assessors to be the total taxable value of land and additions on the property. | Land | Improvement |
|---|---|---|---|---|
| 2025 | $3,244 | $429,700 | $136,800 | $292,900 |
| 2024 | $5,522 | $300,900 | $86,500 | $214,400 |
| 2023 | $5,522 | $300,900 | $86,500 | $214,400 |
| 2022 | $5,356 | $300,900 | $86,500 | $214,400 |
| 2021 | $4,831 | $196,700 | $50,100 | $146,600 |
| 2020 | $4,831 | $196,700 | $50,100 | $146,600 |
| 2019 | $4,831 | $196,700 | $50,100 | $146,600 |
| 2018 | $3,989 | $124,800 | $42,700 | $82,100 |
| 2017 | $3,989 | $124,800 | $42,700 | $82,100 |
| 2016 | $3,989 | $124,800 | $42,700 | $82,100 |
| 2015 | $3,287 | $99,300 | $42,700 | $56,600 |
| 2014 | $3,351 | $99,300 | $42,700 | $56,600 |
| 2013 | $3,351 | $99,300 | $42,700 | $56,600 |
Source: Public Records
Map
Nearby Homes
- 135 Glenbridge Ave
- 69 Bowlet St
- 63 Bowlet St
- 147 Glenbridge Ave
- 79 Bowlet St
- 142 Glenbridge Ave
- 134 Glenbridge Ave
- 153 Glenbridge Ave
- 85 Bowlet St
- 148 Glenbridge Ave
- 127 Glenbridge Ave
- 83 Barbara St
- 61 Barbara St
- 70 Bowlet St
- 89 Bowlet St
- 68 Bowlet St
- 66 Bowlet St
- 76 Bowlet St
- 56 Bowlet St
- 80 Bowlet St
Your Personal Tour Guide
Ask me questions while you tour the home.