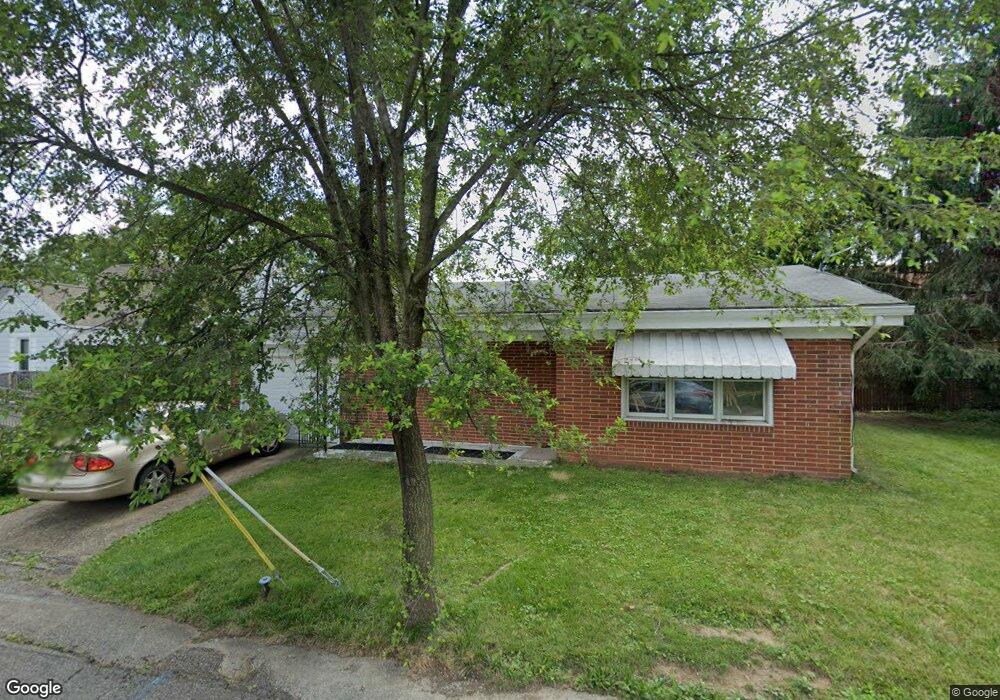
139 Glenwood Heights Mansfield, OH 44903
Estimated Value: $78,224 - $101,000
2
Beds
1
Bath
912
Sq Ft
$103/Sq Ft
Est. Value
About This Home
This home is located at 139 Glenwood Heights, Mansfield, OH 44903 and is currently estimated at $93,806, approximately $102 per square foot. 139 Glenwood Heights is a home located in Richland County with nearby schools including St. Peter's Elementary/Montessori School, St. Peter's High School/Junior High, and Discovery School.
Ownership History
Date
Name
Owned For
Owner Type
Purchase Details
Closed on
Feb 17, 2015
Sold by
Czernewski Eric D and Czernewski Danette L
Bought by
Czernewski Eric D and Czernewski Danette L
Current Estimated Value
Home Financials for this Owner
Home Financials are based on the most recent Mortgage that was taken out on this home.
Original Mortgage
$26,350
Outstanding Balance
$19,987
Interest Rate
3.5%
Mortgage Type
Adjustable Rate Mortgage/ARM
Estimated Equity
$73,819
Purchase Details
Closed on
May 22, 2014
Sold by
Fitzgerald David Andrew
Bought by
Czernewski Eric
Purchase Details
Closed on
May 19, 2006
Sold by
Ickert Fred A and Arnold Nancy J
Bought by
Fitzgerald David Andrew
Home Financials for this Owner
Home Financials are based on the most recent Mortgage that was taken out on this home.
Original Mortgage
$45,700
Interest Rate
6.87%
Mortgage Type
Purchase Money Mortgage
Create a Home Valuation Report for This Property
The Home Valuation Report is an in-depth analysis detailing your home's value as well as a comparison with similar homes in the area
Home Values in the Area
Average Home Value in this Area
Purchase History
| Date | Buyer | Sale Price | Title Company |
|---|---|---|---|
| Czernewski Eric D | -- | Chicago Title | |
| Czernewski Eric | $10,000 | Chicago Title Agency Of Nort | |
| Fitzgerald David Andrew | $45,700 | Southern Title |
Source: Public Records
Mortgage History
| Date | Status | Borrower | Loan Amount |
|---|---|---|---|
| Open | Czernewski Eric D | $26,350 | |
| Previous Owner | Fitzgerald David Andrew | $45,700 |
Source: Public Records
Tax History Compared to Growth
Tax History
| Year | Tax Paid | Tax Assessment Tax Assessment Total Assessment is a certain percentage of the fair market value that is determined by local assessors to be the total taxable value of land and additions on the property. | Land | Improvement |
|---|---|---|---|---|
| 2024 | $623 | $13,010 | $2,020 | $10,990 |
| 2023 | $623 | $13,010 | $2,020 | $10,990 |
| 2022 | $546 | $9,550 | $1,660 | $7,890 |
| 2021 | $549 | $9,550 | $1,660 | $7,890 |
| 2020 | $562 | $9,550 | $1,660 | $7,890 |
| 2019 | $623 | $9,550 | $1,660 | $7,890 |
| 2018 | $615 | $9,550 | $1,660 | $7,890 |
| 2017 | $412 | $9,550 | $1,660 | $7,890 |
| 2016 | $227 | $3,510 | $1,910 | $1,600 |
| 2015 | $227 | $3,510 | $1,910 | $1,600 |
| 2014 | $544 | $13,650 | $1,910 | $11,740 |
| 2012 | -- | $13,640 | $2,010 | $11,630 |
Source: Public Records
Map
Nearby Homes
- 96 Glenwood Heights
- 137 Lexington Ave
- 120 Grover St
- 172 -172 1 2 Lexington Ave
- 186 S Mulberry St
- 286 S Main St
- 353 Sturges Ave
- 212 S Main St
- 259 S Main St
- 37 W Arch St
- 0 Cline Ave Hedeen Abbeyfeale Unit 9066362
- 257 Wood St
- 394 S Main St
- 131 Sturges Ave
- 327 Hammond Ave
- 188 S Franklin Ave
- 135 Wood St
- 319 Altamont Ave
- 116 W 2nd St
- 119 Carpenter Rd
- 86 Mendota St
- 96 Mendota St
- 135 Glenwood Heights
- 102 Mendota St
- 104 Mendota St
- 131 Glenwood Heights
- 82 Mendota St
- 134 Glenwood Heights
- 108 Mendota St
- 130 Glenwood Heights
- 270 S Mulberry St
- 125 Glenwood Heights
- 114 Mendota St
- 126 Glenwood Heights
- 274 S Mulberry St
- 278 S Mulberry St
- 81 Mendota St
- 93 Mendota St
- 89 Mendota St
- 101 Mendota St