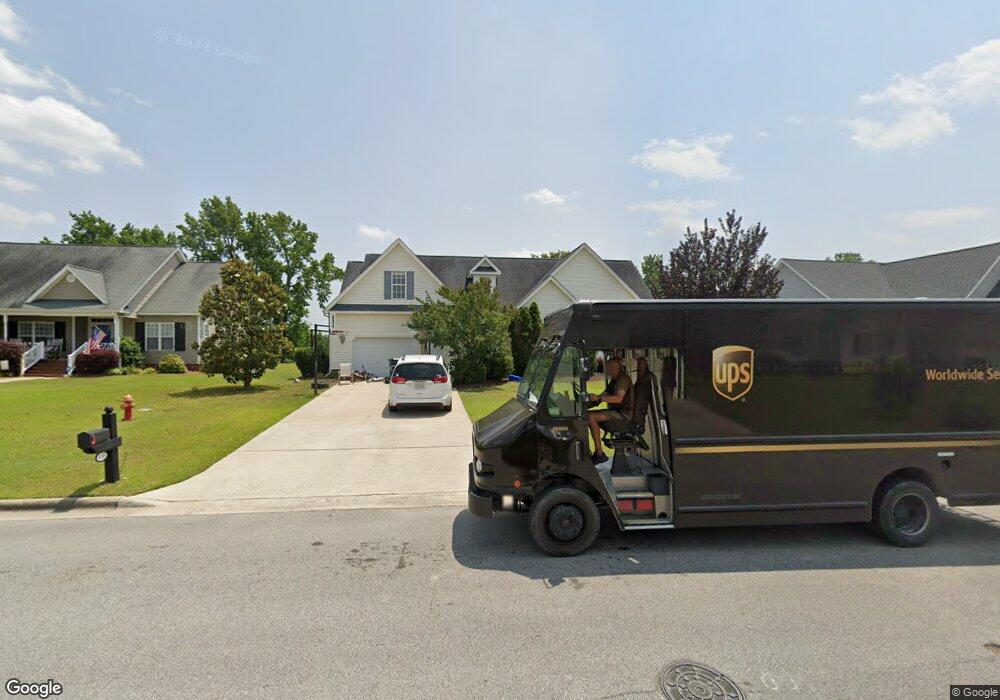
139 Grandifloria Ct Winterville, NC 28590
Estimated Value: $319,000 - $342,000
3
Beds
2
Baths
2,037
Sq Ft
$162/Sq Ft
Est. Value
About This Home
This home is located at 139 Grandifloria Ct, Winterville, NC 28590 and is currently estimated at $329,579, approximately $161 per square foot. 139 Grandifloria Ct is a home located in Pitt County with nearby schools including Creekside Elementary School, A.G. Cox Middle School, and South Central High School.
Ownership History
Date
Name
Owned For
Owner Type
Purchase Details
Closed on
Apr 26, 2010
Sold by
Ferguson Richard W and Ferguson Sybille
Bought by
Hazelwood Corey A and Craig Hazelwood Morgan L
Current Estimated Value
Home Financials for this Owner
Home Financials are based on the most recent Mortgage that was taken out on this home.
Original Mortgage
$219,622
Outstanding Balance
$146,408
Interest Rate
4.94%
Mortgage Type
VA
Estimated Equity
$183,171
Purchase Details
Closed on
Jun 26, 2007
Sold by
Swaim Amy L and Hulings Dana R
Bought by
Ferguson Richard W and Ferguson Sybille
Home Financials for this Owner
Home Financials are based on the most recent Mortgage that was taken out on this home.
Original Mortgage
$70,000
Interest Rate
6.16%
Mortgage Type
New Conventional
Purchase Details
Closed on
Dec 30, 2004
Sold by
Swaim Amy L and Hulings Dana R
Bought by
Swaim Amy L and Hulings Dana R
Create a Home Valuation Report for This Property
The Home Valuation Report is an in-depth analysis detailing your home's value as well as a comparison with similar homes in the area
Home Values in the Area
Average Home Value in this Area
Purchase History
| Date | Buyer | Sale Price | Title Company |
|---|---|---|---|
| Hazelwood Corey A | $215,000 | None Available | |
| Ferguson Richard W | $226,500 | None Available | |
| Swaim Amy L | -- | None Available |
Source: Public Records
Mortgage History
| Date | Status | Borrower | Loan Amount |
|---|---|---|---|
| Open | Hazelwood Corey A | $219,622 | |
| Previous Owner | Ferguson Richard W | $70,000 |
Source: Public Records
Tax History Compared to Growth
Tax History
| Year | Tax Paid | Tax Assessment Tax Assessment Total Assessment is a certain percentage of the fair market value that is determined by local assessors to be the total taxable value of land and additions on the property. | Land | Improvement |
|---|---|---|---|---|
| 2025 | $2,148 | $320,211 | $30,000 | $290,211 |
| 2024 | $2,136 | $320,211 | $30,000 | $290,211 |
| 2023 | $1,628 | $203,828 | $27,500 | $176,328 |
| 2022 | $1,636 | $203,828 | $27,500 | $176,328 |
| 2021 | $1,628 | $203,828 | $27,500 | $176,328 |
| 2020 | $1,638 | $203,828 | $27,500 | $176,328 |
| 2019 | $1,610 | $197,747 | $27,500 | $170,247 |
| 2018 | $1,538 | $197,747 | $27,500 | $170,247 |
| 2017 | $1,538 | $197,747 | $27,500 | $170,247 |
| 2016 | $1,519 | $197,747 | $27,500 | $170,247 |
| 2015 | $1,510 | $198,274 | $27,000 | $171,274 |
| 2014 | $1,510 | $198,274 | $27,000 | $171,274 |
Source: Public Records
Map
Nearby Homes
- 254 Magnolia Dr
- 2620 Delilah Dr
- 363 Eliza Way
- 2920 Jessica Dr Unit A
- 263 Laurie Ellis Rd
- 3011 Dearing Ct
- 351 Winding Meadows Ln
- 312 Brogden Ct
- 2841 Verbena Way
- 2459 Kodiak Dr
- 272 Primrose Ln
- 2520 Ange St
- BOOTH Plan at Villa Grande
- GALEN Plan at Villa Grande
- HAYDEN - DRHE Plan at Villa Grande
- ABERDEEN Plan at Villa Grande
- 2422 Grimes St
- 2626 Delilah Dr
- 2531 Jones St
- 2537 Jones St
- 133 Grandifloria Ct
- 147 Grandifloria Ct
- 127 Grandifloria Ct
- 153 Grandifloria Ct
- 136 Grandifloria Ct
- 144 Grandifloria Ct
- 121 Grandifloria Ct
- 159 Grandifloria Ct
- 150 Grandifloria Ct
- 124 Grandifloria Ct
- 156 Grandifloria Ct
- 115 Grandifloria Ct
- 165 Grandifloria Ct
- 118 Grandifloria Ct
- 162 Grandifloria Ct
- 143 Magnolia Dr
- 149 Magnolia Dr
- 114 Grandifloria Ct
- 135 Magnolia Dr
- 107 Grandifloria Ct