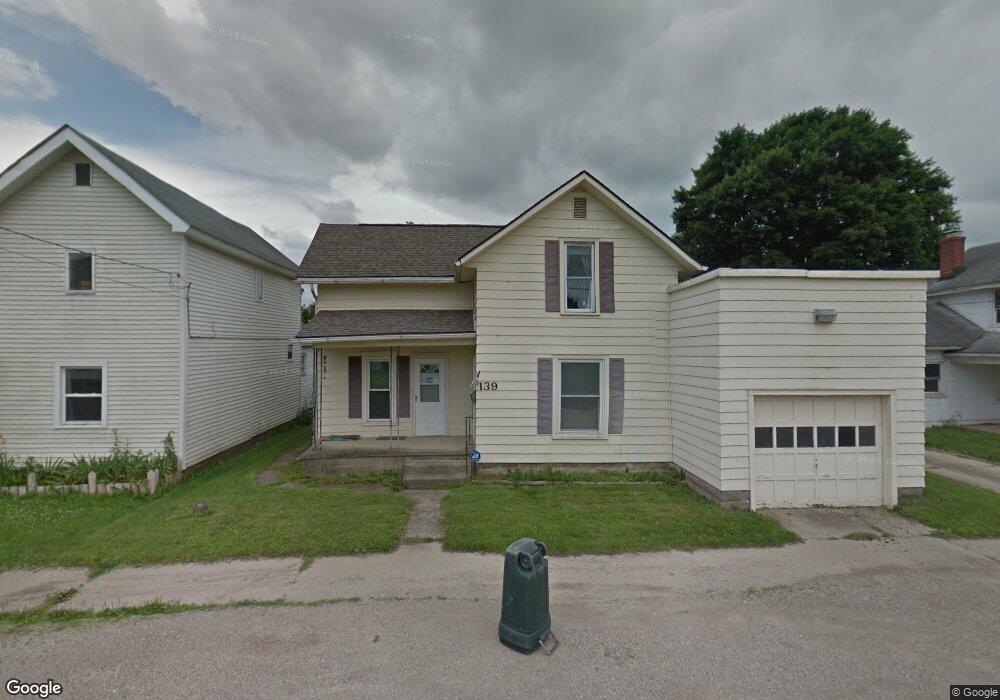
139 Grant St Newark, OH 43055
Estimated Value: $175,000 - $192,500
3
Beds
1
Bath
1,504
Sq Ft
$124/Sq Ft
Est. Value
About This Home
This home is located at 139 Grant St, Newark, OH 43055 and is currently estimated at $186,625, approximately $124 per square foot. 139 Grant St is a home located in Licking County with nearby schools including Mcguffey Elementary School, Wilson Middle School, and Newark High School.
Ownership History
Date
Name
Owned For
Owner Type
Purchase Details
Closed on
Aug 29, 2023
Sold by
Hunt Sheri L and Hunt-Fleming Sheri L
Bought by
Hunt Sheri L
Current Estimated Value
Purchase Details
Closed on
Nov 16, 2007
Sold by
Hunt Sheri L and Hunt Fleming Sheri L
Bought by
Hunt Fleming Sheri L
Home Financials for this Owner
Home Financials are based on the most recent Mortgage that was taken out on this home.
Original Mortgage
$80,000
Interest Rate
6.31%
Mortgage Type
New Conventional
Purchase Details
Closed on
Jun 11, 2004
Sold by
Lampton Leslie D and Lampton Pamela A
Bought by
Hunt Sheri L
Home Financials for this Owner
Home Financials are based on the most recent Mortgage that was taken out on this home.
Original Mortgage
$75,000
Interest Rate
6.06%
Mortgage Type
Unknown
Create a Home Valuation Report for This Property
The Home Valuation Report is an in-depth analysis detailing your home's value as well as a comparison with similar homes in the area
Home Values in the Area
Average Home Value in this Area
Purchase History
| Date | Buyer | Sale Price | Title Company |
|---|---|---|---|
| Hunt Sheri L | -- | None Listed On Document | |
| Hunt Fleming Sheri L | -- | Vta Title | |
| Hunt Sheri L | $75,000 | -- |
Source: Public Records
Mortgage History
| Date | Status | Borrower | Loan Amount |
|---|---|---|---|
| Previous Owner | Hunt Fleming Sheri L | $80,000 | |
| Previous Owner | Hunt Sheri L | $75,000 |
Source: Public Records
Tax History Compared to Growth
Tax History
| Year | Tax Paid | Tax Assessment Tax Assessment Total Assessment is a certain percentage of the fair market value that is determined by local assessors to be the total taxable value of land and additions on the property. | Land | Improvement |
|---|---|---|---|---|
| 2024 | $1,690 | $47,250 | $10,500 | $36,750 |
| 2023 | $1,687 | $47,250 | $10,500 | $36,750 |
| 2022 | $1,442 | $35,910 | $6,300 | $29,610 |
| 2021 | $1,512 | $35,910 | $6,300 | $29,610 |
| 2020 | $1,546 | $35,910 | $6,300 | $29,610 |
| 2019 | $1,255 | $28,040 | $5,250 | $22,790 |
| 2018 | $1,255 | $0 | $0 | $0 |
| 2017 | $1,203 | $0 | $0 | $0 |
| 2016 | $1,054 | $0 | $0 | $0 |
| 2015 | $1,077 | $0 | $0 | $0 |
| 2014 | $1,379 | $0 | $0 | $0 |
| 2013 | $1,053 | $0 | $0 | $0 |
Source: Public Records
Map
Nearby Homes