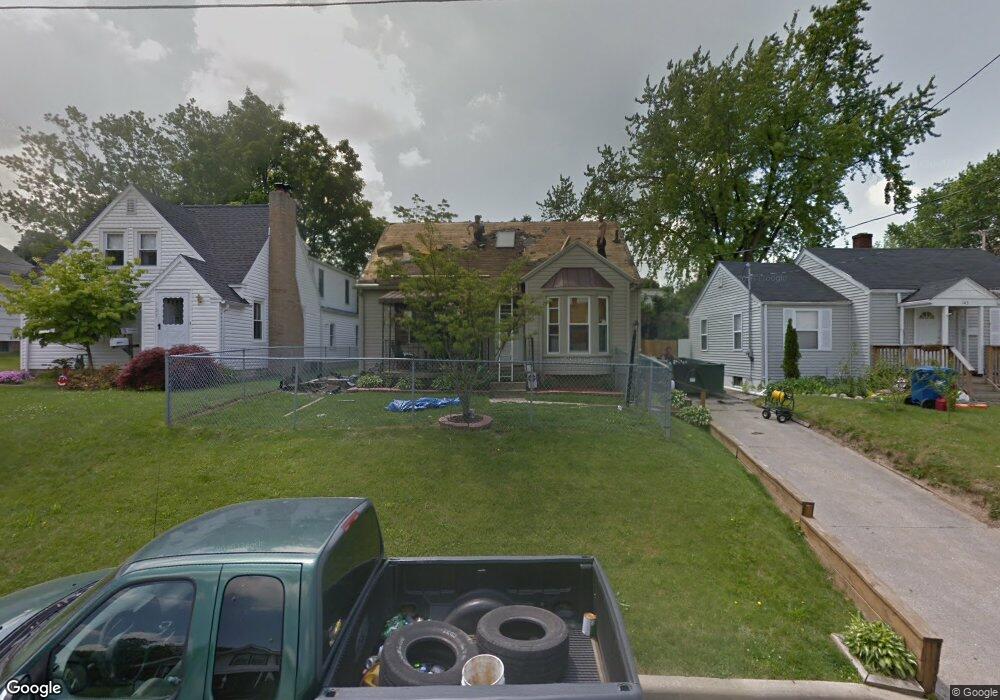
139 Grover St Mansfield, OH 44903
Estimated Value: $94,000 - $126,000
2
Beds
1
Bath
1,076
Sq Ft
$101/Sq Ft
Est. Value
About This Home
This home is located at 139 Grover St, Mansfield, OH 44903 and is currently estimated at $108,457, approximately $100 per square foot. 139 Grover St is a home located in Richland County with nearby schools including St. Peter's Elementary/Montessori School, St. Peter's High School/Junior High, and Discovery School.
Ownership History
Date
Name
Owned For
Owner Type
Purchase Details
Closed on
Apr 19, 2004
Sold by
Va
Bought by
Mills Donald Edward
Current Estimated Value
Home Financials for this Owner
Home Financials are based on the most recent Mortgage that was taken out on this home.
Original Mortgage
$64,490
Outstanding Balance
$30,009
Interest Rate
5.5%
Mortgage Type
FHA
Estimated Equity
$78,448
Purchase Details
Closed on
Sep 23, 2003
Sold by
Carr Gregory M
Bought by
Va
Purchase Details
Closed on
Nov 13, 1997
Sold by
Presler Tamara S
Bought by
Carr Gregory M and Carr Nancy L
Home Financials for this Owner
Home Financials are based on the most recent Mortgage that was taken out on this home.
Original Mortgage
$66,900
Interest Rate
7.43%
Mortgage Type
VA
Purchase Details
Closed on
Oct 29, 1996
Sold by
Whatman Chevette
Bought by
Swartz Kim A and Swartz Tamara S
Purchase Details
Closed on
May 1, 1989
Create a Home Valuation Report for This Property
The Home Valuation Report is an in-depth analysis detailing your home's value as well as a comparison with similar homes in the area
Home Values in the Area
Average Home Value in this Area
Purchase History
| Date | Buyer | Sale Price | Title Company |
|---|---|---|---|
| Mills Donald Edward | -- | Multiple | |
| Va | $40,000 | -- | |
| Carr Gregory M | $66,900 | -- | |
| Swartz Kim A | $13,500 | -- | |
| -- | $29,500 | -- |
Source: Public Records
Mortgage History
| Date | Status | Borrower | Loan Amount |
|---|---|---|---|
| Open | Mills Donald Edward | $64,490 | |
| Previous Owner | Carr Gregory M | $66,900 |
Source: Public Records
Tax History Compared to Growth
Tax History
| Year | Tax Paid | Tax Assessment Tax Assessment Total Assessment is a certain percentage of the fair market value that is determined by local assessors to be the total taxable value of land and additions on the property. | Land | Improvement |
|---|---|---|---|---|
| 2024 | $847 | $18,080 | $2,880 | $15,200 |
| 2023 | $847 | $18,080 | $2,880 | $15,200 |
| 2022 | $654 | $11,700 | $2,360 | $9,340 |
| 2021 | $658 | $11,700 | $2,360 | $9,340 |
| 2020 | $673 | $11,700 | $2,360 | $9,340 |
| 2019 | $746 | $11,700 | $2,360 | $9,340 |
| 2018 | $736 | $11,700 | $2,360 | $9,340 |
| 2017 | $716 | $11,700 | $2,360 | $9,340 |
| 2016 | $955 | $15,140 | $2,730 | $12,410 |
| 2015 | $913 | $15,140 | $2,730 | $12,410 |
| 2014 | $901 | $15,140 | $2,730 | $12,410 |
| 2012 | $343 | $15,140 | $2,870 | $12,270 |
Source: Public Records
Map
Nearby Homes
- 353 Sturges Ave
- 120 Grover St
- 172 -172 1 2 Lexington Ave
- 0 Cline Ave Hedeen Abbeyfeale Unit 9066362
- 137 Lexington Ave
- 394 S Main St
- 96 Glenwood Heights
- 286 S Main St
- 257 Wood St
- 505 Wood St
- 259 S Main St
- 186 S Mulberry St
- 212 S Main St
- 327 Hammond Ave
- 37 W Arch St
- 131 Sturges Ave
- 319 Altamont Ave
- 135 Wood St
- 188 S Franklin Ave
- 470 Lexington Ave