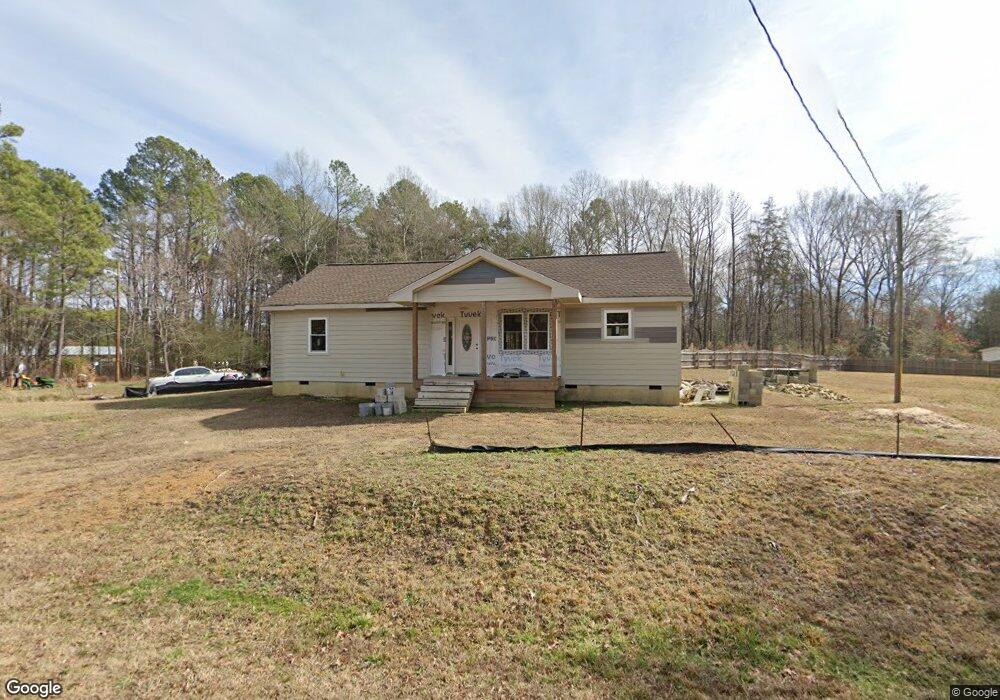
139 Guthrie Rd Pittsboro, NC 27312
Estimated Value: $169,671 - $690,000
2
Beds
1
Bath
900
Sq Ft
$433/Sq Ft
Est. Value
About This Home
This home is located at 139 Guthrie Rd, Pittsboro, NC 27312 and is currently estimated at $389,557, approximately $432 per square foot. 139 Guthrie Rd is a home located in Chatham County with nearby schools including J.S. Waters Elementary School and Chatham Central High.
Ownership History
Date
Name
Owned For
Owner Type
Purchase Details
Closed on
Sep 28, 2025
Sold by
Tapia Reynaldo Marin
Bought by
Benitez Ines Alejandra Pe
Current Estimated Value
Home Financials for this Owner
Home Financials are based on the most recent Mortgage that was taken out on this home.
Original Mortgage
$161,500
Outstanding Balance
$161,500
Interest Rate
6.58%
Mortgage Type
New Conventional
Estimated Equity
$228,057
Purchase Details
Closed on
Feb 13, 2020
Sold by
Abiel Llc
Bought by
Tapia Reyraldo Marin
Purchase Details
Closed on
Dec 1, 2019
Sold by
Richardson Cynthia P and Richardson Donald
Bought by
Abiel Llc
Purchase Details
Closed on
Mar 1, 2019
Sold by
Pugh Mclver Vanessa Pugh and Pugh Carnegie Cynthia
Bought by
Abiel Llc
Purchase Details
Closed on
Dec 31, 1996
Bought by
Pugh Emma Guthrie Life Est
Create a Home Valuation Report for This Property
The Home Valuation Report is an in-depth analysis detailing your home's value as well as a comparison with similar homes in the area
Home Values in the Area
Average Home Value in this Area
Purchase History
| Date | Buyer | Sale Price | Title Company |
|---|---|---|---|
| Benitez Ines Alejandra Pe | $170,000 | None Listed On Document | |
| Tapia Reyraldo Marin | $25,000 | None Available | |
| Abiel Llc | -- | None Available | |
| Abiel Llc | $1,000 | None Available | |
| Pugh Emma Guthrie Life Est | -- | -- |
Source: Public Records
Mortgage History
| Date | Status | Borrower | Loan Amount |
|---|---|---|---|
| Open | Benitez Ines Alejandra Pe | $161,500 |
Source: Public Records
Tax History Compared to Growth
Tax History
| Year | Tax Paid | Tax Assessment Tax Assessment Total Assessment is a certain percentage of the fair market value that is determined by local assessors to be the total taxable value of land and additions on the property. | Land | Improvement |
|---|---|---|---|---|
| 2025 | $1,518 | $181,760 | $24,000 | $157,760 |
| 2024 | $663 | $79,342 | $18,487 | $60,855 |
| 2023 | $663 | $65,819 | $18,487 | $47,332 |
| 2022 | $497 | $65,819 | $18,487 | $47,332 |
| 2021 | $140 | $18,487 | $18,487 | $0 |
| 2020 | $233 | $30,658 | $13,030 | $17,628 |
| 2019 | $233 | $30,658 | $13,030 | $17,628 |
| 2018 | $0 | $30,658 | $13,030 | $17,628 |
| 2017 | $220 | $30,658 | $13,030 | $17,628 |
| 2016 | $247 | $34,080 | $14,493 | $19,587 |
| 2015 | $239 | $34,080 | $14,493 | $19,587 |
| 2014 | -- | $34,080 | $14,493 | $19,587 |
| 2013 | -- | $34,080 | $14,493 | $19,587 |
Source: Public Records
Map
Nearby Homes
- 0 Dewitt Smith Rd Unit 10069047
- 33 Holly Run
- 65 Oak Spring Dr
- 0 Wildwood Dr
- 9646 Nc Highway 902
- 81 Little Creek Ln
- 5982 Pleasant Hill Church Rd
- TBD Pleasant Hill Church Rd
- 2b Lucy Mae Page Rd
- 652 Richardson Rd
- 1838 Alex Cockman Rd
- 0 Horton Rd Unit 10084516
- 0 Horton Rd Unit 24291688
- 786 Horton Rd
- 0 Horton Rd Unit 100496609
- 0 Horton Rd Unit 1174762
- 194 Jack Alston Rd
- 1545 Alex Cockman Rd
- Tbd Walnut Springs
- 1433 Ralph Moore Rd
- 123 Guthrie Rd
- 205 Guthrie Rd
- 235 Guthrie Rd Unit 11
- 235 Guthrie Rd
- 124 Guthrie Rd
- 207 Guthrie Rd
- 207 Guthrie Rd
- 235 Guthrie Rd
- 235 Guthrie Rd Unit 11
- 54 Guthrie Rd
- 1029 Dewitt Smith Rd
- 250 Guthrie Rd
- 1229 Dewitt Smith Rd
- 981 Dewitt Smith Rd
- 441 Guthrie Rd
- 284 Guthrie Rd
- 281 Guthrie Rd
- 300 Guthrie Rd
- 1092 Dewitt Smith Rd
- 974 Dewitt Smith Rd