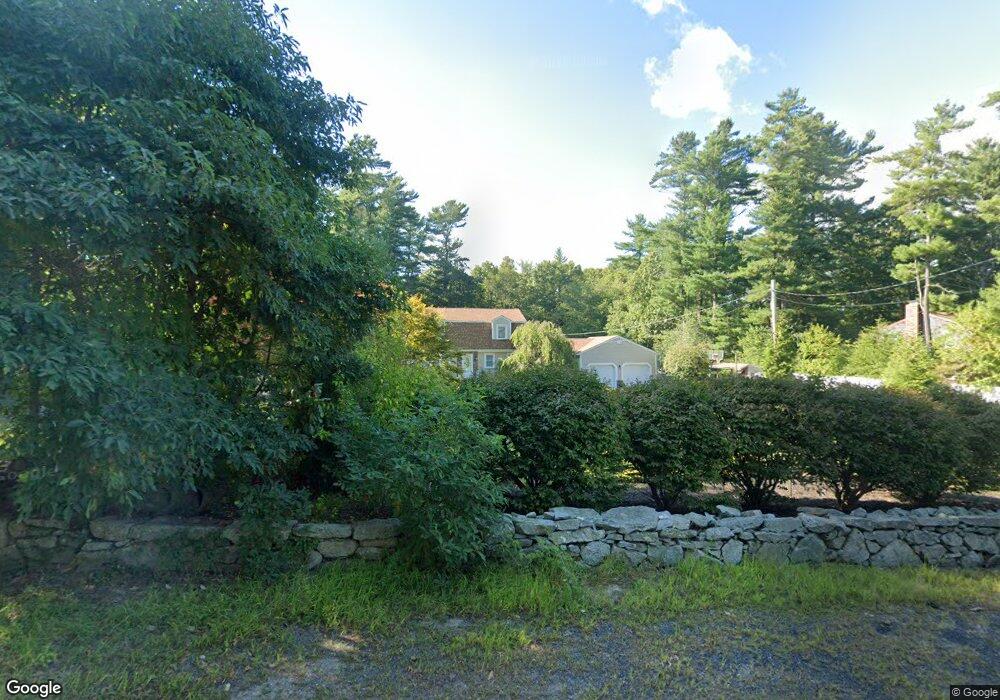
139 Howland Rd Assonet, MA 02702
Estimated Value: $568,000 - $634,000
3
Beds
2
Baths
1,856
Sq Ft
$330/Sq Ft
Est. Value
About This Home
This home is located at 139 Howland Rd, Assonet, MA 02702 and is currently estimated at $612,519, approximately $330 per square foot. 139 Howland Rd is a home located in Bristol County with nearby schools including Freetown Elementary School, George R Austin Intermediate School, and Freetown-Lakeville Middle School.
Ownership History
Date
Name
Owned For
Owner Type
Purchase Details
Closed on
Jan 7, 2008
Sold by
Bouley Kimberly M
Bought by
Oliveira Jose A and Oliveira Maria C
Current Estimated Value
Home Financials for this Owner
Home Financials are based on the most recent Mortgage that was taken out on this home.
Original Mortgage
$256,000
Outstanding Balance
$162,516
Interest Rate
6.27%
Mortgage Type
Purchase Money Mortgage
Estimated Equity
$450,003
Purchase Details
Closed on
Jun 28, 2005
Sold by
Lafrance Kathleen A and Lafrance Kevin J
Bought by
Bouley Kimberly M
Home Financials for this Owner
Home Financials are based on the most recent Mortgage that was taken out on this home.
Original Mortgage
$342,800
Interest Rate
5.82%
Mortgage Type
Purchase Money Mortgage
Create a Home Valuation Report for This Property
The Home Valuation Report is an in-depth analysis detailing your home's value as well as a comparison with similar homes in the area
Home Values in the Area
Average Home Value in this Area
Purchase History
| Date | Buyer | Sale Price | Title Company |
|---|---|---|---|
| Oliveira Jose A | $320,000 | -- | |
| Bouley Kimberly M | $428,500 | -- |
Source: Public Records
Mortgage History
| Date | Status | Borrower | Loan Amount |
|---|---|---|---|
| Open | Oliveira Jose A | $256,000 | |
| Previous Owner | Bouley Kimberly M | $342,800 |
Source: Public Records
Tax History Compared to Growth
Tax History
| Year | Tax Paid | Tax Assessment Tax Assessment Total Assessment is a certain percentage of the fair market value that is determined by local assessors to be the total taxable value of land and additions on the property. | Land | Improvement |
|---|---|---|---|---|
| 2025 | $5,089 | $513,500 | $161,900 | $351,600 |
| 2024 | $5,101 | $489,100 | $152,700 | $336,400 |
| 2023 | $4,967 | $463,800 | $137,500 | $326,300 |
| 2022 | $4,749 | $393,800 | $116,500 | $277,300 |
| 2021 | $4,613 | $363,200 | $105,900 | $257,300 |
| 2020 | $4,571 | $351,100 | $101,900 | $249,200 |
| 2019 | $4,326 | $329,000 | $97,000 | $232,000 |
| 2018 | $4,114 | $309,100 | $97,000 | $212,100 |
| 2017 | $3,993 | $299,800 | $97,000 | $202,800 |
| 2016 | $3,939 | $300,900 | $94,200 | $206,700 |
| 2015 | $3,862 | $299,400 | $94,200 | $205,200 |
| 2014 | $3,731 | $295,900 | $92,300 | $203,600 |
Source: Public Records
Map
Nearby Homes
- 7 Great Cedar Crossing
- 6 Weetamoe Dr
- 24 Bells Brook Rd
- 20 Slab Bridge Rd
- 195 Slab Bridge Rd
- 14 Alberta Ln
- 52 Anthony St
- 37 Simpson Ln
- 165 Padelford St
- 1 Elm St
- 5 Freetown St
- 5 Hadley Heights Way
- 16 Water St Unit A
- 16 Water St Unit C
- 16 Water St Unit B
- 16 Water St Unit D
- 4 Hadley Heights Way
- 42 High St
- 144 Chace Rd
- 22 Freemens Cir