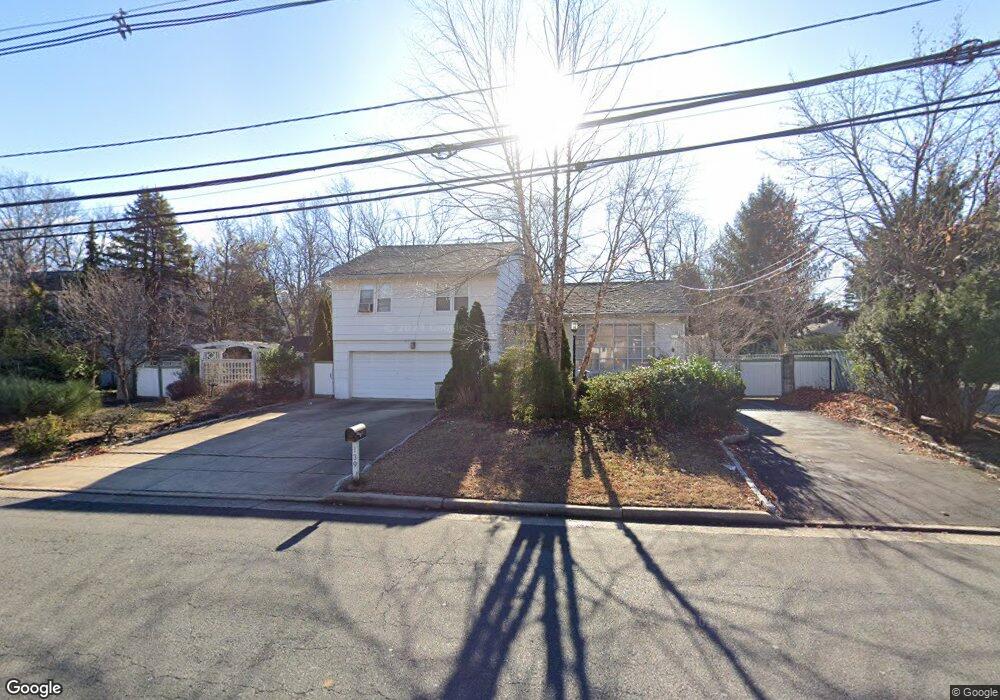
139 James St Edison, NJ 08820
Estimated Value: $701,000 - $816,000
--
Bed
--
Bath
1,648
Sq Ft
$466/Sq Ft
Est. Value
About This Home
This home is located at 139 James St, Edison, NJ 08820 and is currently estimated at $768,191, approximately $466 per square foot. 139 James St is a home located in Middlesex County with nearby schools including Menlo Park Elementary School, Woodrow Wilson Middle School, and J.P. Stevens High School.
Ownership History
Date
Name
Owned For
Owner Type
Purchase Details
Closed on
Sep 15, 2000
Sold by
Raiti Mary
Bought by
Balasta Rodel and Balasta Maria Luisa
Current Estimated Value
Home Financials for this Owner
Home Financials are based on the most recent Mortgage that was taken out on this home.
Original Mortgage
$249,300
Outstanding Balance
$89,830
Interest Rate
7.94%
Estimated Equity
$678,361
Create a Home Valuation Report for This Property
The Home Valuation Report is an in-depth analysis detailing your home's value as well as a comparison with similar homes in the area
Home Values in the Area
Average Home Value in this Area
Purchase History
| Date | Buyer | Sale Price | Title Company |
|---|---|---|---|
| Balasta Rodel | $277,000 | -- |
Source: Public Records
Mortgage History
| Date | Status | Borrower | Loan Amount |
|---|---|---|---|
| Open | Balasta Rodel | $249,300 |
Source: Public Records
Tax History Compared to Growth
Tax History
| Year | Tax Paid | Tax Assessment Tax Assessment Total Assessment is a certain percentage of the fair market value that is determined by local assessors to be the total taxable value of land and additions on the property. | Land | Improvement |
|---|---|---|---|---|
| 2025 | $12,376 | $207,900 | $114,600 | $93,300 |
| 2024 | $12,310 | $207,900 | $114,600 | $93,300 |
| 2023 | $12,310 | $207,900 | $114,600 | $93,300 |
| 2022 | $12,314 | $207,900 | $114,600 | $93,300 |
| 2021 | $12,272 | $207,900 | $114,600 | $93,300 |
| 2020 | $12,160 | $207,900 | $114,600 | $93,300 |
| 2019 | $11,190 | $207,900 | $114,600 | $93,300 |
| 2018 | $11,172 | $207,900 | $114,600 | $93,300 |
| 2017 | $11,172 | $207,900 | $114,600 | $93,300 |
| 2016 | $10,969 | $207,900 | $114,600 | $93,300 |
| 2015 | $10,549 | $207,900 | $114,600 | $93,300 |
| 2014 | $10,241 | $207,900 | $114,600 | $93,300 |
Source: Public Records
Map
Nearby Homes