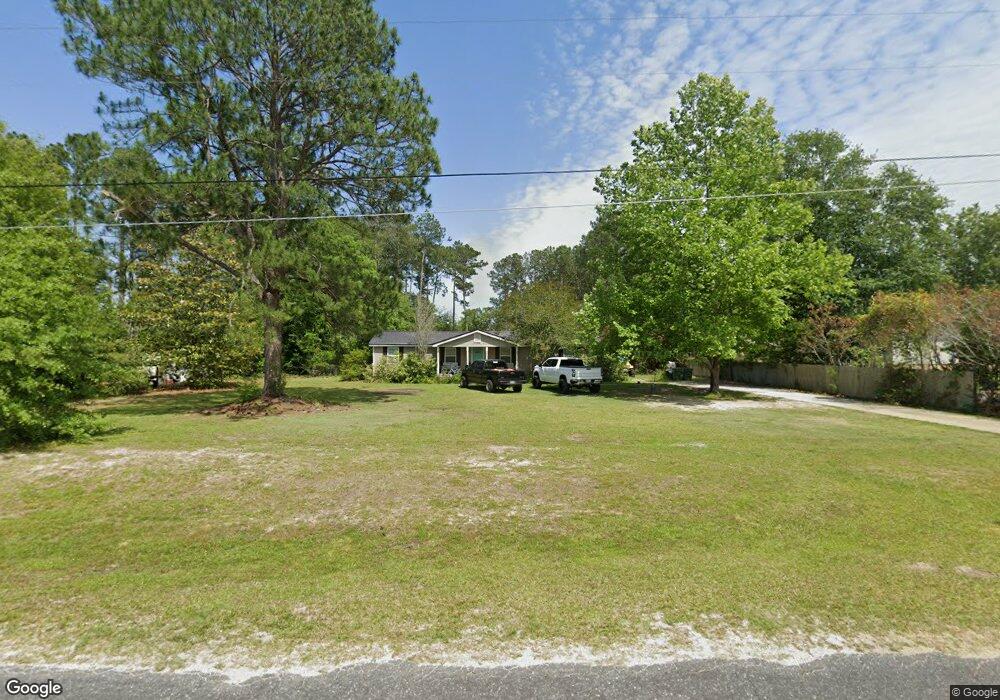
139 Lb Nevels Rd Moultrie, GA 31768
Estimated Value: $203,179 - $549,000
--
Bed
1
Bath
1,680
Sq Ft
$191/Sq Ft
Est. Value
About This Home
This home is located at 139 Lb Nevels Rd, Moultrie, GA 31768 and is currently estimated at $321,045, approximately $191 per square foot. 139 Lb Nevels Rd is a home located in Colquitt County with nearby schools including Sunset Elementary School, Willie J. Williams Middle School, and C.A. Gray Junior High School.
Ownership History
Date
Name
Owned For
Owner Type
Purchase Details
Closed on
Aug 11, 2017
Sold by
Hurst Douglas R
Bought by
Kennedy Christopher J and Kennedy Kelli M
Current Estimated Value
Home Financials for this Owner
Home Financials are based on the most recent Mortgage that was taken out on this home.
Original Mortgage
$127,645
Outstanding Balance
$105,901
Interest Rate
3.75%
Mortgage Type
FHA
Estimated Equity
$215,144
Purchase Details
Closed on
Apr 26, 2007
Sold by
Hurst Douglas R
Bought by
Hurst Douglas R and Hurst Angela D
Purchase Details
Closed on
Aug 17, 1999
Sold by
Pittman Stanley C
Bought by
Hurst Douglas R
Purchase Details
Closed on
Dec 23, 1998
Sold by
Wood Kenneth D
Bought by
Pittman Stanley C
Purchase Details
Closed on
May 8, 1997
Bought by
Wood Kenneth D
Purchase Details
Closed on
Jun 27, 1996
Bought by
Harrell Clyde
Purchase Details
Closed on
Jan 18, 1977
Bought by
Barfield Bessie Bell
Create a Home Valuation Report for This Property
The Home Valuation Report is an in-depth analysis detailing your home's value as well as a comparison with similar homes in the area
Home Values in the Area
Average Home Value in this Area
Purchase History
| Date | Buyer | Sale Price | Title Company |
|---|---|---|---|
| Kennedy Christopher J | $130,000 | -- | |
| Hurst Douglas R | -- | -- | |
| Hurst Douglas R | $32,000 | -- | |
| Pittman Stanley C | $20,000 | -- | |
| Wood Kenneth D | $18,000 | -- | |
| Harrell Clyde | $15,000 | -- | |
| Barfield Bessie Bell | -- | -- |
Source: Public Records
Mortgage History
| Date | Status | Borrower | Loan Amount |
|---|---|---|---|
| Open | Kennedy Christopher J | $127,645 |
Source: Public Records
Tax History Compared to Growth
Tax History
| Year | Tax Paid | Tax Assessment Tax Assessment Total Assessment is a certain percentage of the fair market value that is determined by local assessors to be the total taxable value of land and additions on the property. | Land | Improvement |
|---|---|---|---|---|
| 2024 | $1,392 | $71,889 | $2,253 | $69,636 |
| 2023 | $1,474 | $56,159 | $2,253 | $53,906 |
| 2022 | $1,146 | $50,148 | $2,003 | $48,145 |
| 2021 | $1,013 | $43,702 | $2,003 | $41,699 |
| 2020 | $955 | $40,645 | $2,003 | $38,642 |
| 2019 | $1,006 | $38,607 | $2,003 | $36,604 |
| 2018 | $988 | $38,607 | $2,003 | $36,604 |
| 2017 | $337 | $14,368 | $1,920 | $12,448 |
| 2016 | $341 | $14,368 | $1,920 | $12,448 |
| 2015 | $344 | $14,368 | $1,920 | $12,448 |
| 2014 | $338 | $14,368 | $1,920 | $12,448 |
| 2013 | -- | $14,368 | $1,920 | $12,448 |
Source: Public Records
Map
Nearby Homes
- 199 Lb Nevels Rd
- 265 Lb Nevels Rd
- XX Us Highway 319 S Unit 8-11
- 117 Will Rd
- 135 Southlake Dr
- 0 Shade Murphy Rd Unit 12
- 534 Us Highway 319 S
- 00 Ragin Rd Unit 7
- 00 Ragin Rd Unit 12
- 387 Tanglewood Dr
- 3 Baell Trace Ct SE
- 208 Baell Trace Ct SE
- 205 Baell Trace Ct SE
- 213 Baell Trace Ct SE
- 1557 US Highway 319 S
- 114 Baell Trace Ct SE
- xx Ga Hwy 319 N
- 64 Mcintosh Place SE
- 30 Marys Ln
- 5 Bracken Dr
- 143 Lb Nevels Rd Unit one
- 127 Lb Nevels Rd
- 153 Lb Nevels Rd
- 117 Lb Nevels Rd
- 120 Lb Nevels Rd
- 128 Lb Nevels Rd
- 177 Lb Nevels Rd
- 160 Lb Nevels Rd
- 353 Shade Murphy Rd
- 138 Lb Nevels Rd
- 187 Lb Nevels Rd
- 279 Shade Murphy Rd
- 216 Lb Nevels Rd
- 280 Shade Murphy Rd
- 253 Shade Murphy Rd
- 473 Shade Murphy Rd
- 110 Moncrief Rd
- 233 Shade Murphy Rd
- 229 Lb Nevels Rd
- 250 Shade Murphy Rd