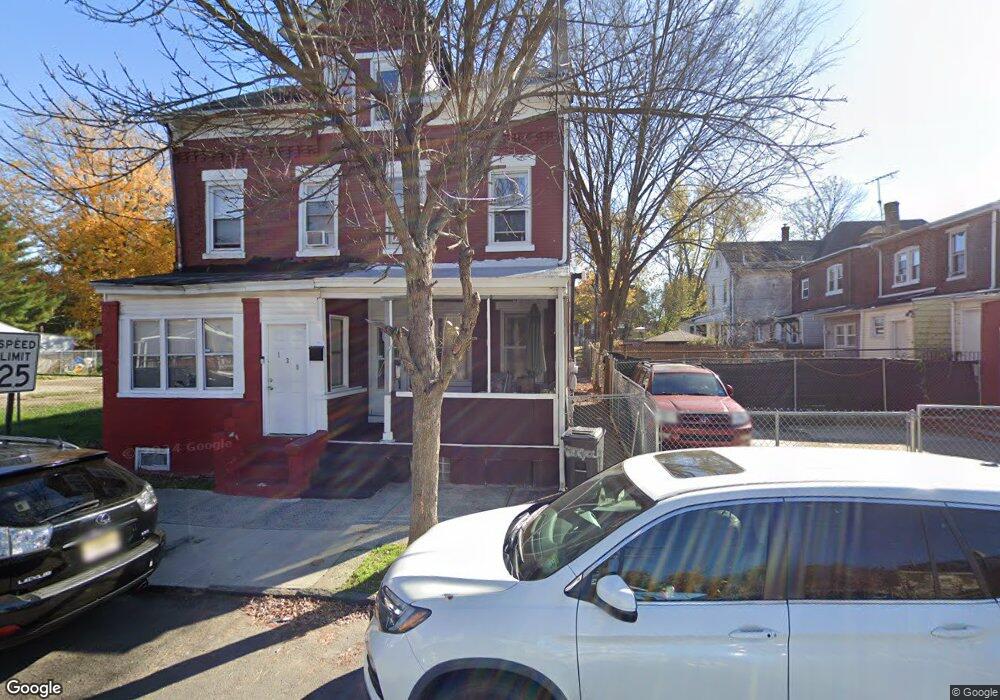
139 Locust St Trenton, NJ 08609
Greenwood & Hamilton NeighborhoodEstimated Value: $165,407 - $257,000
3
Beds
1
Bath
1,252
Sq Ft
$158/Sq Ft
Est. Value
About This Home
This home is located at 139 Locust St, Trenton, NJ 08609 and is currently estimated at $197,602, approximately $157 per square foot. 139 Locust St is a home located in Mercer County with nearby schools including P.J. Hill Elementary School, Grant Elementary School, and Dr. Martin Luther King Middle School.
Ownership History
Date
Name
Owned For
Owner Type
Purchase Details
Closed on
Sep 30, 2022
Sold by
Yaw Holdings Llc
Bought by
Yaw Equity Llc
Current Estimated Value
Home Financials for this Owner
Home Financials are based on the most recent Mortgage that was taken out on this home.
Original Mortgage
$601,750
Outstanding Balance
$577,023
Interest Rate
5.55%
Mortgage Type
New Conventional
Estimated Equity
-$379,421
Purchase Details
Closed on
Mar 8, 2022
Sold by
Chikodi Demings
Bought by
Yaw Holdings Llc
Purchase Details
Closed on
Oct 29, 2008
Sold by
Fed Natl Mtg Assn
Bought by
Washington Chikodi
Purchase Details
Closed on
Jun 27, 2008
Sold by
Kevin C Larkin Sheriff Of Mercer
Bought by
Fed Natl Mtg Assoc
Purchase Details
Closed on
Aug 28, 2002
Sold by
Tiger Relocation Co
Bought by
Edwards Cheryl
Purchase Details
Closed on
Dec 1, 1997
Sold by
Mitchell Leroy
Bought by
Vargas Benjamin
Create a Home Valuation Report for This Property
The Home Valuation Report is an in-depth analysis detailing your home's value as well as a comparison with similar homes in the area
Home Values in the Area
Average Home Value in this Area
Purchase History
| Date | Buyer | Sale Price | Title Company |
|---|---|---|---|
| Yaw Equity Llc | -- | Dekel Abstract | |
| Yaw Equity Llc | -- | Dekel Abstract | |
| Yaw Holdings Llc | $60,000 | Dekel Abstract | |
| Yaw Holdings Llc | $60,000 | Dekel Abstract | |
| Washington Chikodi | $17,500 | -- | |
| Washington Chikodi | $17,500 | Fortune Title Agency | |
| Fed Natl Mtg Assoc | -- | -- | |
| Edwards Cheryl | $13,000 | -- | |
| Vargas Benjamin | $18,000 | -- |
Source: Public Records
Mortgage History
| Date | Status | Borrower | Loan Amount |
|---|---|---|---|
| Open | Yaw Equity Llc | $601,750 | |
| Closed | Yaw Equity Llc | $601,750 |
Source: Public Records
Tax History Compared to Growth
Tax History
| Year | Tax Paid | Tax Assessment Tax Assessment Total Assessment is a certain percentage of the fair market value that is determined by local assessors to be the total taxable value of land and additions on the property. | Land | Improvement |
|---|---|---|---|---|
| 2025 | $2,732 | $47,100 | $5,800 | $41,300 |
| 2024 | $2,622 | $47,100 | $5,800 | $41,300 |
| 2023 | $2,622 | $47,100 | $5,800 | $41,300 |
| 2022 | $2,571 | $47,100 | $5,800 | $41,300 |
| 2021 | $2,615 | $47,100 | $5,800 | $41,300 |
| 2020 | $2,607 | $47,100 | $5,800 | $41,300 |
| 2019 | $2,565 | $47,100 | $5,800 | $41,300 |
| 2018 | $2,455 | $47,100 | $5,800 | $41,300 |
| 2017 | $2,334 | $47,100 | $5,800 | $41,300 |
| 2016 | $2,129 | $37,000 | $5,900 | $31,100 |
| 2015 | $2,121 | $37,000 | $5,900 | $31,100 |
| 2014 | $2,111 | $37,000 | $5,900 | $31,100 |
Source: Public Records
Map
Nearby Homes