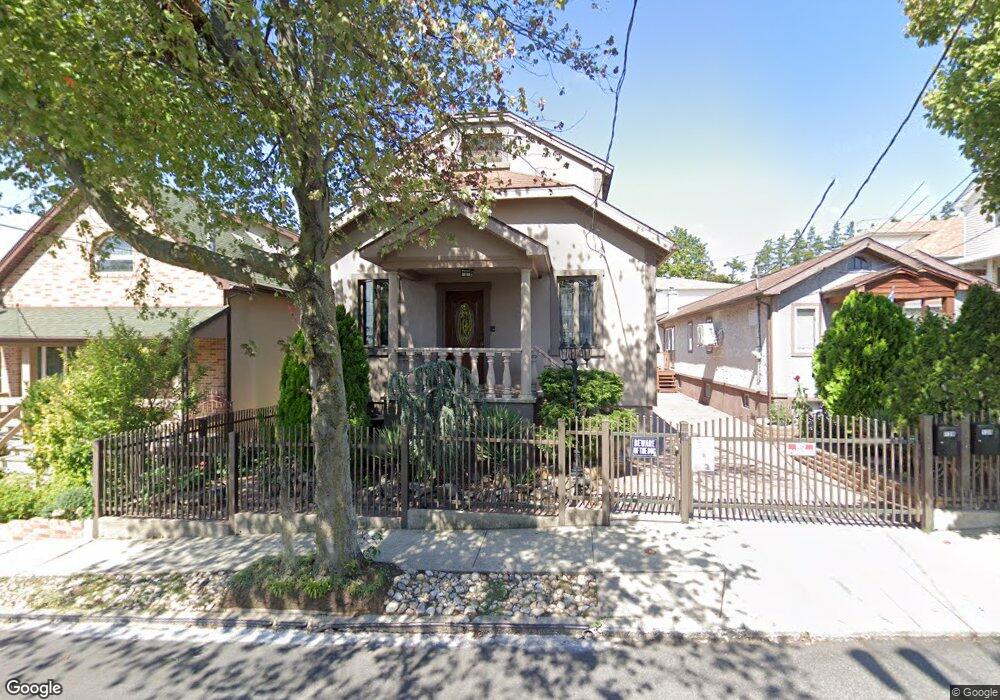
139 Macfarland Ave Staten Island, NY 10305
South Beach NeighborhoodEstimated Value: $729,198 - $971,000
--
Bed
--
Bath
1,560
Sq Ft
$566/Sq Ft
Est. Value
About This Home
This home is located at 139 Macfarland Ave, Staten Island, NY 10305 and is currently estimated at $882,300, approximately $565 per square foot. 139 Macfarland Ave is a home located in Richmond County with nearby schools including P.S. 39 The Francis J. Murphy Jr. School, I.S. 49 Berta A Dreyfus, and Curtis High School.
Ownership History
Date
Name
Owned For
Owner Type
Purchase Details
Closed on
Jan 4, 2000
Sold by
Yennella Michael and Yennella Mary Ann
Bought by
Osewski Henryk and Osewski Miroslawa U
Current Estimated Value
Home Financials for this Owner
Home Financials are based on the most recent Mortgage that was taken out on this home.
Original Mortgage
$68,000
Interest Rate
8.24%
Create a Home Valuation Report for This Property
The Home Valuation Report is an in-depth analysis detailing your home's value as well as a comparison with similar homes in the area
Home Values in the Area
Average Home Value in this Area
Purchase History
| Date | Buyer | Sale Price | Title Company |
|---|---|---|---|
| Osewski Henryk | $85,000 | Commonwealth Land Title Ins |
Source: Public Records
Mortgage History
| Date | Status | Borrower | Loan Amount |
|---|---|---|---|
| Previous Owner | Osewski Henryk | $68,000 |
Source: Public Records
Tax History Compared to Growth
Tax History
| Year | Tax Paid | Tax Assessment Tax Assessment Total Assessment is a certain percentage of the fair market value that is determined by local assessors to be the total taxable value of land and additions on the property. | Land | Improvement |
|---|---|---|---|---|
| 2025 | $6,448 | $47,580 | $7,620 | $39,960 |
| 2024 | $6,449 | $41,220 | $8,739 | $32,481 |
| 2023 | $6,324 | $31,138 | $8,190 | $22,948 |
| 2022 | $5,561 | $34,680 | $11,220 | $23,460 |
| 2021 | $5,928 | $35,880 | $11,220 | $24,660 |
| 2020 | $5,700 | $38,760 | $11,220 | $27,540 |
| 2019 | $5,597 | $34,680 | $11,220 | $23,460 |
| 2018 | $5,289 | $25,948 | $9,842 | $16,106 |
| 2017 | $4,990 | $24,480 | $10,218 | $14,262 |
| 2016 | $4,692 | $23,472 | $10,758 | $12,714 |
| 2015 | $4,279 | $22,440 | $9,360 | $13,080 |
| 2014 | $4,279 | $22,296 | $8,108 | $14,188 |
Source: Public Records
Map
Nearby Homes
- 137 Macfarland Ave
- 143 Macfarland Ave
- 80 Sand Ln
- 86 Sand Ln
- 90 Sand Ln
- 290 Major Ave
- 147 Macfarland Ave
- 292 Major Ave
- 140 Macfarland Ave
- 144 Macfarland Ave
- 294 Major Ave
- 138 Macfarland Ave
- 136 Macfarland Ave
- 146 Macfarland Ave
- 165 Macfarland Ave
- 100 Sand Ln
- 134 Macfarland Ave
- 300 Major Ave
- 160 Macfarland Ave
- 66 Sand Ln