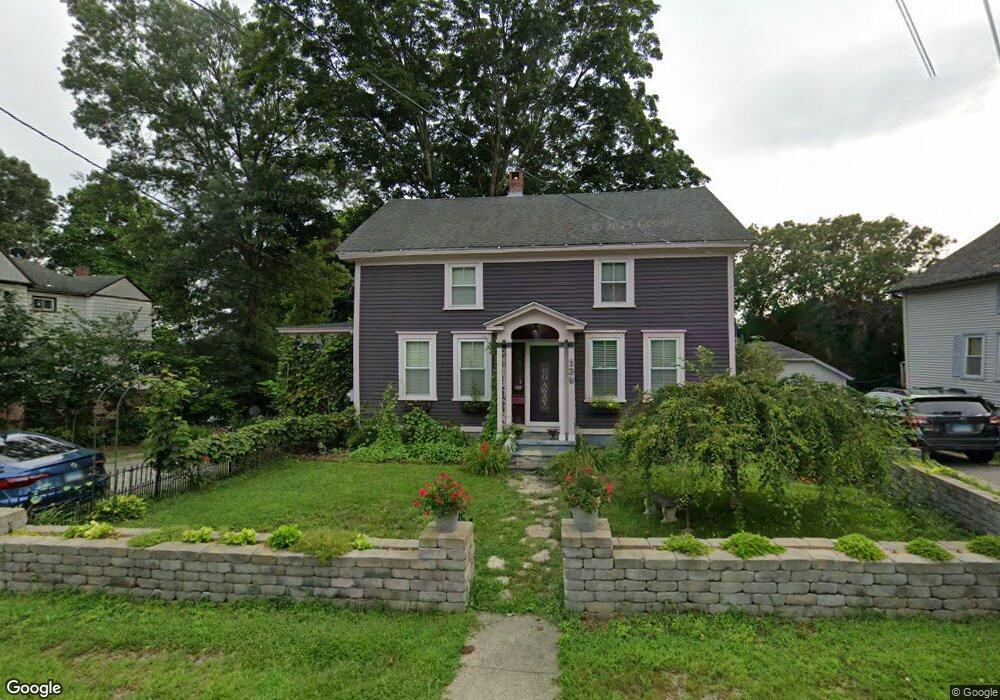
139 Maple St Danielson, CT 06239
Estimated Value: $318,693 - $405,000
4
Beds
1
Bath
1,840
Sq Ft
$194/Sq Ft
Est. Value
About This Home
This home is located at 139 Maple St, Danielson, CT 06239 and is currently estimated at $357,173, approximately $194 per square foot. 139 Maple St is a home located in Windham County with nearby schools including Killingly Central School, Killingly Memorial School, and Killingly Intermediate School.
Ownership History
Date
Name
Owned For
Owner Type
Purchase Details
Closed on
Jan 31, 2011
Sold by
Watson Gail A
Bought by
Roberts Angelique M
Current Estimated Value
Purchase Details
Closed on
Dec 5, 2007
Sold by
Anthony Richard E and Anthony Mary A
Bought by
Roberts Angelique M and Watson Gail A
Create a Home Valuation Report for This Property
The Home Valuation Report is an in-depth analysis detailing your home's value as well as a comparison with similar homes in the area
Home Values in the Area
Average Home Value in this Area
Purchase History
| Date | Buyer | Sale Price | Title Company |
|---|---|---|---|
| Roberts Angelique M | -- | -- | |
| Roberts Angelique M | -- | -- | |
| Roberts Angelique M | $190,000 | -- | |
| Roberts Angelique M | $190,000 | -- |
Source: Public Records
Mortgage History
| Date | Status | Borrower | Loan Amount |
|---|---|---|---|
| Closed | Roberts Angelique M | $0 | |
| Closed | Roberts Angelique M | $29,675 | |
| Previous Owner | Roberts Angelique M | $191,312 |
Source: Public Records
Tax History
| Year | Tax Paid | Tax Assessment Tax Assessment Total Assessment is a certain percentage of the fair market value that is determined by local assessors to be the total taxable value of land and additions on the property. | Land | Improvement |
|---|---|---|---|---|
| 2025 | $4,386 | $175,080 | $27,670 | $147,410 |
| 2024 | $4,187 | $175,080 | $27,670 | $147,410 |
| 2023 | $3,185 | $99,260 | $23,030 | $76,230 |
| 2022 | $2,997 | $99,260 | $23,030 | $76,230 |
| 2021 | $2,976 | $98,560 | $23,030 | $75,530 |
| 2020 | $2,926 | $98,560 | $23,030 | $75,530 |
| 2019 | $2,958 | $98,560 | $23,030 | $75,530 |
| 2017 | $2,367 | $73,360 | $14,700 | $58,660 |
| 2016 | $1,680 | $52,080 | $14,700 | $37,380 |
Source: Public Records
Map
Nearby Homes
Your Personal Tour Guide
Ask me questions while you tour the home.