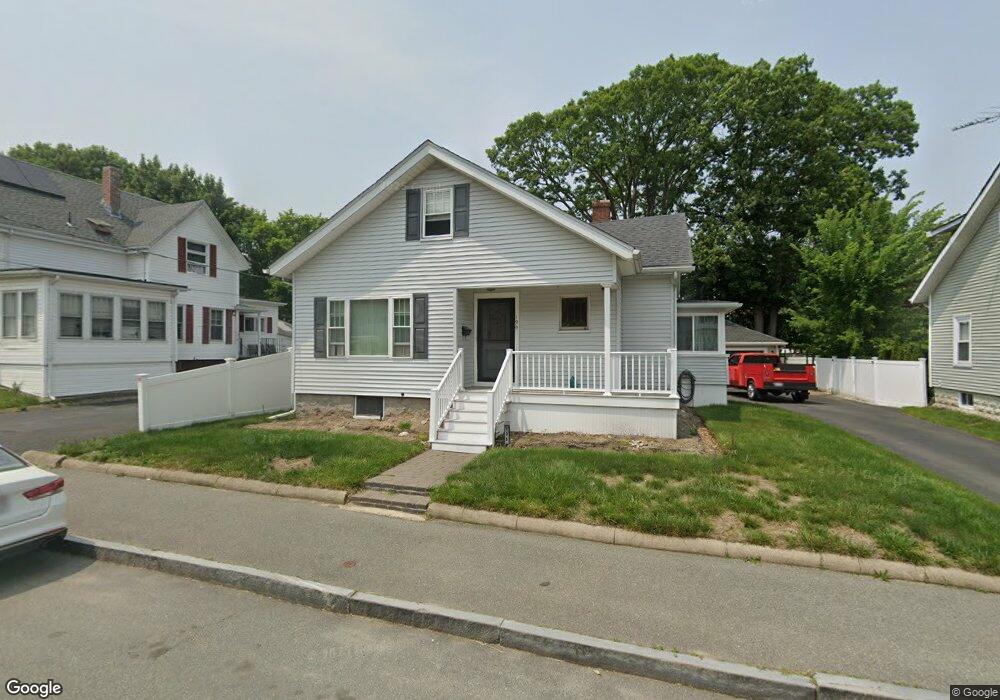
139 Menlo St Brockton, MA 02301
Clifton Heights NeighborhoodEstimated Value: $416,000 - $444,000
2
Beds
1
Bath
1,228
Sq Ft
$352/Sq Ft
Est. Value
About This Home
This home is located at 139 Menlo St, Brockton, MA 02301 and is currently estimated at $432,438, approximately $352 per square foot. 139 Menlo St is a home located in Plymouth County with nearby schools including John F. Kennedy Elementary School, Davis K-8 School, and South Middle School.
Ownership History
Date
Name
Owned For
Owner Type
Purchase Details
Closed on
Jul 17, 2000
Sold by
Meehan Patrick J and Meehan Mary M
Bought by
Badger Michael L
Current Estimated Value
Home Financials for this Owner
Home Financials are based on the most recent Mortgage that was taken out on this home.
Original Mortgage
$122,310
Interest Rate
8.5%
Mortgage Type
Purchase Money Mortgage
Purchase Details
Closed on
Nov 24, 1993
Sold by
Hurley John E
Bought by
Meehan Patrick J and Meehan Mary M
Purchase Details
Closed on
Aug 14, 1990
Sold by
Hurley Frederick L
Bought by
Hurley John E
Create a Home Valuation Report for This Property
The Home Valuation Report is an in-depth analysis detailing your home's value as well as a comparison with similar homes in the area
Home Values in the Area
Average Home Value in this Area
Purchase History
| Date | Buyer | Sale Price | Title Company |
|---|---|---|---|
| Badger Michael L | $135,900 | -- | |
| Meehan Patrick J | $85,900 | -- | |
| Hurley John E | $100,000 | -- |
Source: Public Records
Mortgage History
| Date | Status | Borrower | Loan Amount |
|---|---|---|---|
| Open | Hurley John E | $118,820 | |
| Closed | Hurley John E | $123,000 | |
| Closed | Hurley John E | $121,890 | |
| Closed | Hurley John E | $122,310 |
Source: Public Records
Tax History Compared to Growth
Tax History
| Year | Tax Paid | Tax Assessment Tax Assessment Total Assessment is a certain percentage of the fair market value that is determined by local assessors to be the total taxable value of land and additions on the property. | Land | Improvement |
|---|---|---|---|---|
| 2025 | $4,479 | $369,900 | $138,400 | $231,500 |
| 2024 | $4,413 | $367,100 | $138,400 | $228,700 |
| 2023 | $4,228 | $325,700 | $103,100 | $222,600 |
| 2022 | $4,287 | $306,900 | $93,700 | $213,200 |
| 2021 | $4,115 | $283,800 | $77,600 | $206,200 |
| 2020 | $3,924 | $259,000 | $72,900 | $186,100 |
| 2019 | $3,685 | $237,100 | $70,900 | $166,200 |
| 2018 | $3,379 | $210,400 | $70,900 | $139,500 |
| 2017 | $3,170 | $196,900 | $70,900 | $126,000 |
| 2016 | $2,974 | $171,300 | $68,700 | $102,600 |
| 2015 | $2,873 | $158,300 | $68,700 | $89,600 |
| 2014 | $2,743 | $151,300 | $68,700 | $82,600 |
Source: Public Records
Map
Nearby Homes