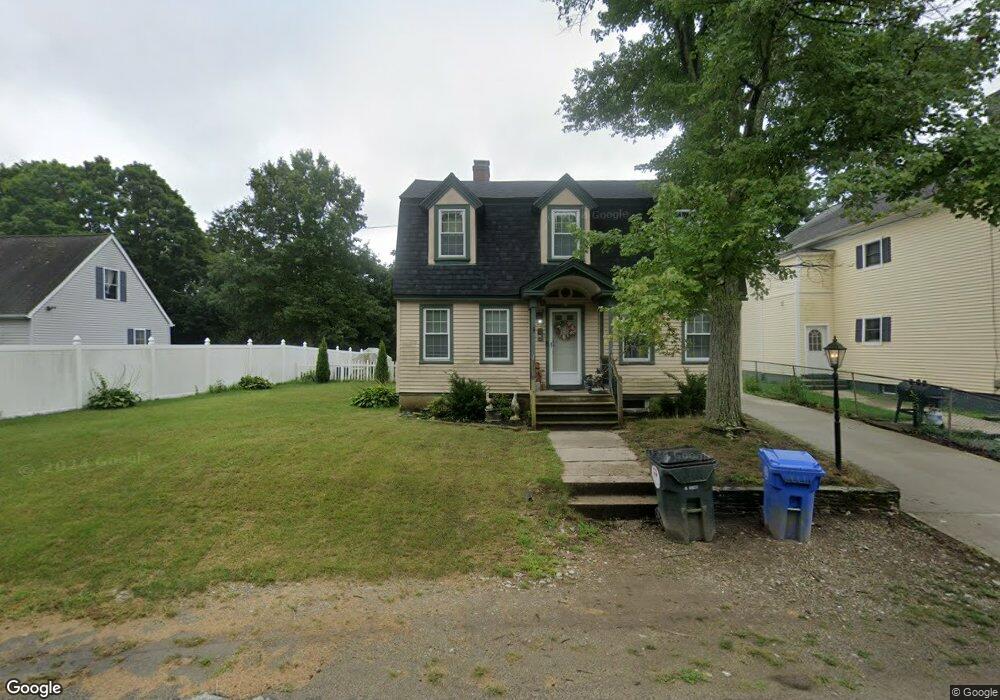
139 Morin Ave Danielson, CT 06239
Estimated Value: $278,000 - $387,000
3
Beds
1
Bath
1,554
Sq Ft
$209/Sq Ft
Est. Value
About This Home
This home is located at 139 Morin Ave, Danielson, CT 06239 and is currently estimated at $324,090, approximately $208 per square foot. 139 Morin Ave is a home located in Windham County with nearby schools including Killingly Central School, Killingly Memorial School, and Killingly Intermediate School.
Ownership History
Date
Name
Owned For
Owner Type
Purchase Details
Closed on
Mar 24, 2011
Sold by
Lsf 6 Mercury Reo Int
Bought by
Hanton Michael
Current Estimated Value
Purchase Details
Closed on
Aug 17, 2010
Sold by
Maerkel Peter G and Maerkel Tammy L
Bought by
Inves Lsf6 Mercury Reo
Purchase Details
Closed on
May 6, 1992
Sold by
White Leo and White Amy
Bought by
Maerkel Peter and Maerkel Tammy
Create a Home Valuation Report for This Property
The Home Valuation Report is an in-depth analysis detailing your home's value as well as a comparison with similar homes in the area
Home Values in the Area
Average Home Value in this Area
Purchase History
| Date | Buyer | Sale Price | Title Company |
|---|---|---|---|
| Hanton Michael | $112,000 | -- | |
| Hanton Michael | $112,000 | -- | |
| Inves Lsf6 Mercury Reo | -- | -- | |
| Lsf6 Mercury Reo Inves | -- | -- | |
| Maerkel Peter | $77,000 | -- | |
| Maerkel Peter | $77,000 | -- |
Source: Public Records
Mortgage History
| Date | Status | Borrower | Loan Amount |
|---|---|---|---|
| Previous Owner | Maerkel Peter | $207,300 | |
| Previous Owner | Maerkel Peter | $18,500 |
Source: Public Records
Tax History
| Year | Tax Paid | Tax Assessment Tax Assessment Total Assessment is a certain percentage of the fair market value that is determined by local assessors to be the total taxable value of land and additions on the property. | Land | Improvement |
|---|---|---|---|---|
| 2025 | $3,599 | $153,480 | $29,850 | $123,630 |
| 2024 | $3,387 | $153,480 | $29,850 | $123,630 |
| 2023 | $3,227 | $112,630 | $24,570 | $88,060 |
| 2022 | $3,031 | $112,630 | $24,570 | $88,060 |
| 2021 | $3,031 | $112,630 | $24,570 | $88,060 |
| 2020 | $2,967 | $112,630 | $24,570 | $88,060 |
| 2019 | $3,025 | $112,630 | $24,570 | $88,060 |
| 2017 | $2,660 | $91,070 | $15,750 | $75,320 |
| 2016 | $2,651 | $91,070 | $15,750 | $75,320 |
| 2015 | $2,669 | $91,070 | $15,750 | $75,320 |
| 2014 | $2,596 | $91,070 | $15,750 | $75,320 |
Source: Public Records
Map
Nearby Homes
- 48 Athol St Unit 48
- 74 Athol St
- 144 Prospect Ave
- 10 Center St
- 24 Center St
- 133 Maple St
- 73 Hawkins St
- 37 Ruth St
- 102 Cottage St
- 135 Adelaide St
- 150 Broad St
- 37 Katherine Ave
- 85 Furnace St
- 85 Mashentuck Rd
- 18 Broad St
- 61 Deerwood Dr
- 35 S Main St
- 14 Valley View Dr
- 16 Valley View Dr
- 0 Providence Rd Unit 24080985
- 135 Morin Ave
- 131 Morin Ave
- 18 Connecticut Mills Ave
- 26 Connecticut Mills Ave Unit Apartment d
- 26 Connecticut Mills Ave Unit Apartment C
- 26 Connecticut Mills Ave
- 123 Morin Ave
- 162 North St
- 8 Connecticut Mills Ave
- 117 Morin Ave
- 42 Connecticut Mills Ave
- 17 James St
- 5 Francis St
- 23 James St
- 111 Morin Ave
- 152 North St
- 124 Morin Ave
- 33 James St
- 13 Francis St
- 50 Connecticut Mills Ave
Your Personal Tour Guide
Ask me questions while you tour the home.