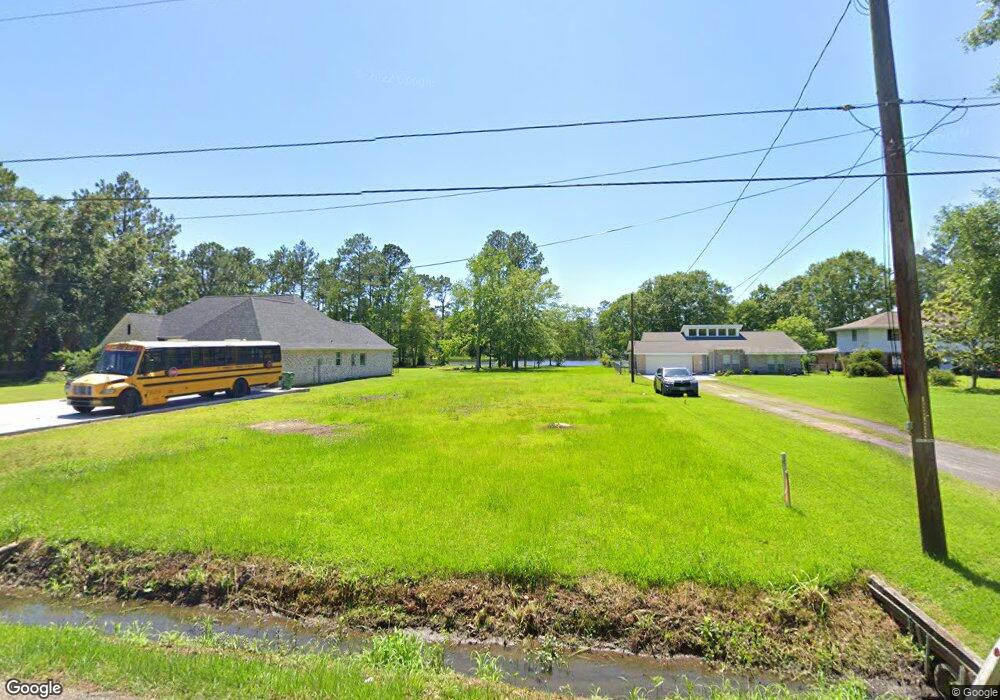
139 Morrow Dr Slidell, LA 70461
Estimated Value: $98,000
--
Bed
--
Bath
920
Sq Ft
$107/Sq Ft
Est. Value
About This Home
This home is located at 139 Morrow Dr, Slidell, LA 70461 and is currently estimated at $98,000, approximately $106 per square foot. 139 Morrow Dr is a home located in St. Tammany Parish with nearby schools including Cypress Cove Elementary School, Little Oak Middle School, and Honey Island Elementary School.
Ownership History
Date
Name
Owned For
Owner Type
Purchase Details
Closed on
Sep 27, 2019
Sold by
Custom Craft Homes Inc
Bought by
Foltz Andrew Chance
Current Estimated Value
Home Financials for this Owner
Home Financials are based on the most recent Mortgage that was taken out on this home.
Original Mortgage
$50,000,000
Outstanding Balance
$43,315,860
Interest Rate
3.5%
Mortgage Type
New Conventional
Estimated Equity
-$43,217,860
Purchase Details
Closed on
Jan 9, 2019
Sold by
Parker Carolyn Sean and Fontenberry Carrie E
Bought by
Custom Craft Homes Inc
Purchase Details
Closed on
Sep 14, 2018
Sold by
Thompson Barbara J and Thompson Wayne
Bought by
Fortenberry Carolyn Sean
Purchase Details
Closed on
Sep 13, 2018
Sold by
Hughes Carol and Hughes Frankie
Bought by
Fortenberry Carolyn Sean
Purchase Details
Closed on
Nov 29, 2017
Sold by
Yourk Construction Co Inc
Bought by
Fontenberry Carolyn P
Create a Home Valuation Report for This Property
The Home Valuation Report is an in-depth analysis detailing your home's value as well as a comparison with similar homes in the area
Home Values in the Area
Average Home Value in this Area
Purchase History
| Date | Buyer | Sale Price | Title Company |
|---|---|---|---|
| Foltz Andrew Chance | $37,000 | First American Title | |
| Custom Craft Homes Inc | $25,000 | Allegiance Title | |
| Fortenberry Carolyn Sean | -- | None Available | |
| Fortenberry Carolyn Sean | -- | None Available | |
| Fontenberry Carolyn P | $2,450 | -- |
Source: Public Records
Mortgage History
| Date | Status | Borrower | Loan Amount |
|---|---|---|---|
| Open | Foltz Andrew Chance | $50,000,000 |
Source: Public Records
Tax History
| Year | Tax Paid | Tax Assessment Tax Assessment Total Assessment is a certain percentage of the fair market value that is determined by local assessors to be the total taxable value of land and additions on the property. | Land | Improvement |
|---|---|---|---|---|
| 2025 | $290 | $2,000 | $2,000 | $0 |
| 2024 | $290 | $2,000 | $2,000 | $0 |
| 2023 | $301 | $4,691 | $2,000 | $2,691 |
| 2022 | $70,417 | $4,691 | $2,000 | $2,691 |
| 2021 | $703 | $4,691 | $2,000 | $2,691 |
| 2020 | $700 | $4,691 | $2,000 | $2,691 |
| 2019 | $788 | $5,126 | $462 | $4,664 |
| 2018 | $791 | $5,126 | $462 | $4,664 |
| 2017 | $796 | $5,126 | $462 | $4,664 |
| 2016 | $814 | $5,126 | $462 | $4,664 |
| 2015 | $837 | $5,126 | $462 | $4,664 |
| 2014 | $821 | $5,126 | $462 | $4,664 |
Source: Public Records
Map
Nearby Homes
Your Personal Tour Guide
Ask me questions while you tour the home.