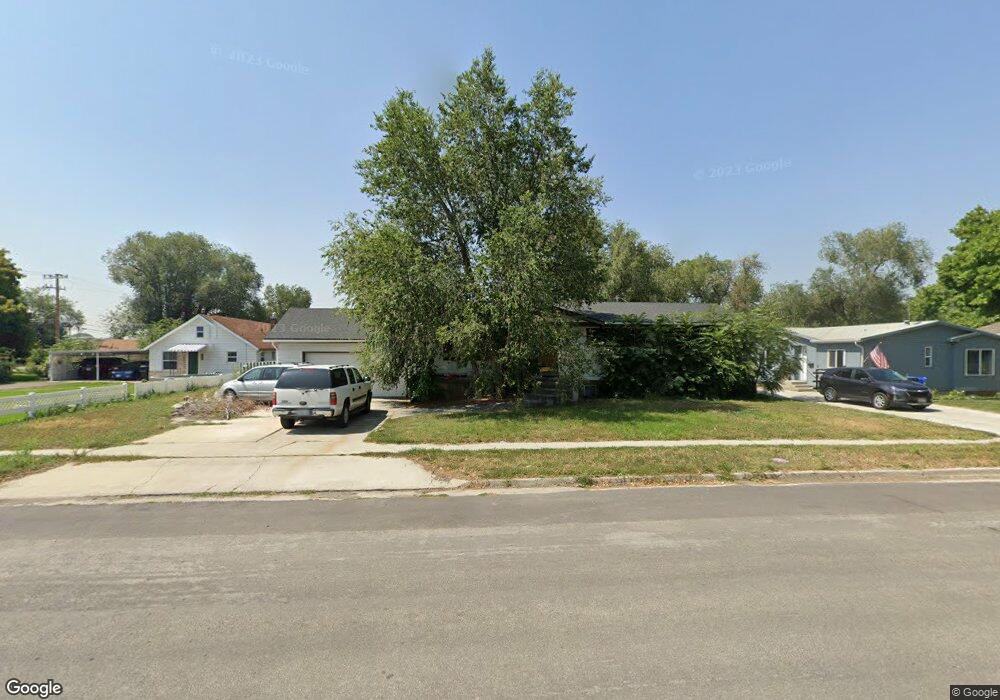
139 N 100 W Tremonton, UT 84337
Estimated Value: $351,000 - $395,000
5
Beds
2
Baths
2,316
Sq Ft
$161/Sq Ft
Est. Value
About This Home
This home is located at 139 N 100 W, Tremonton, UT 84337 and is currently estimated at $372,915, approximately $161 per square foot. 139 N 100 W is a home located in Box Elder County with nearby schools including North Park School, Alice C. Harris Intermediate School, and Bear River Middle School.
Ownership History
Date
Name
Owned For
Owner Type
Purchase Details
Closed on
Sep 19, 2007
Sold by
Hurd Willa
Bought by
Hurd Willa and Willa Hurd Revocable Trust
Current Estimated Value
Purchase Details
Closed on
Oct 25, 2006
Sold by
Hurd Willa C
Bought by
Shumway Terrel and Shumway Julie
Home Financials for this Owner
Home Financials are based on the most recent Mortgage that was taken out on this home.
Original Mortgage
$145,000
Interest Rate
6.39%
Mortgage Type
New Conventional
Create a Home Valuation Report for This Property
The Home Valuation Report is an in-depth analysis detailing your home's value as well as a comparison with similar homes in the area
Home Values in the Area
Average Home Value in this Area
Purchase History
| Date | Buyer | Sale Price | Title Company |
|---|---|---|---|
| Hurd Willa | -- | None Available | |
| Shumway Terrel | -- | None Available |
Source: Public Records
Mortgage History
| Date | Status | Borrower | Loan Amount |
|---|---|---|---|
| Open | Shumway Terrel H | $4,294 | |
| Previous Owner | Shumway Terrel | $145,000 |
Source: Public Records
Tax History Compared to Growth
Tax History
| Year | Tax Paid | Tax Assessment Tax Assessment Total Assessment is a certain percentage of the fair market value that is determined by local assessors to be the total taxable value of land and additions on the property. | Land | Improvement |
|---|---|---|---|---|
| 2025 | $2,199 | $375,449 | $105,000 | $270,449 |
| 2024 | $2,199 | $372,917 | $105,000 | $267,917 |
| 2023 | $2,271 | $378,330 | $100,000 | $278,330 |
| 2022 | $2,048 | $194,474 | $16,500 | $177,974 |
| 2021 | $1,710 | $227,559 | $30,000 | $197,559 |
| 2020 | $1,505 | $227,559 | $30,000 | $197,559 |
| 2019 | $1,396 | $112,657 | $16,500 | $96,157 |
| 2018 | $1,048 | $78,660 | $13,750 | $64,910 |
| 2017 | $1,100 | $143,019 | $13,750 | $118,019 |
| 2016 | $1,082 | $75,569 | $13,750 | $61,819 |
| 2015 | $983 | $69,950 | $13,750 | $56,200 |
| 2014 | $983 | $67,273 | $13,750 | $53,523 |
| 2013 | -- | $67,274 | $13,338 | $53,936 |
Source: Public Records
Map
Nearby Homes