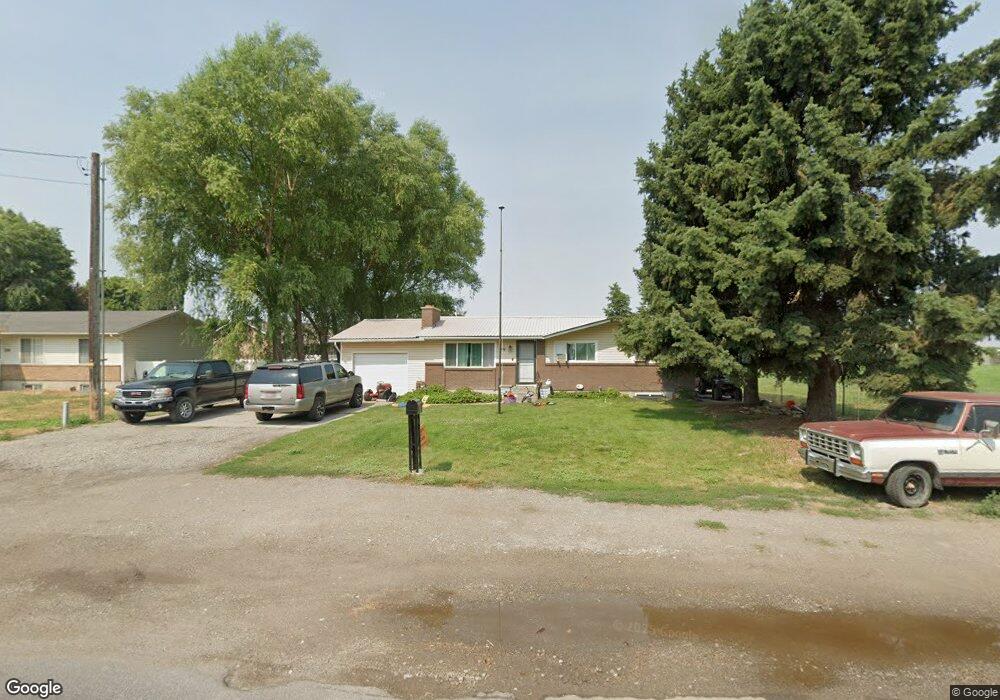
139 N 3rd E Franklin, ID 83237
Estimated Value: $362,000 - $408,000
5
Beds
2
Baths
2,400
Sq Ft
$160/Sq Ft
Est. Value
About This Home
This home is located at 139 N 3rd E, Franklin, ID 83237 and is currently estimated at $384,057, approximately $160 per square foot. 139 N 3rd E is a home located in Franklin County with nearby schools including Oakwood Elementary School, Pioneer Elementary School, and Preston Junior High School.
Ownership History
Date
Name
Owned For
Owner Type
Purchase Details
Closed on
May 25, 2017
Sold by
Will Sharp Homes Inc
Bought by
Munson Tyson Lewis and Munson Erin Katherine
Current Estimated Value
Home Financials for this Owner
Home Financials are based on the most recent Mortgage that was taken out on this home.
Original Mortgage
$132,323
Outstanding Balance
$109,983
Interest Rate
4.08%
Mortgage Type
New Conventional
Estimated Equity
$274,075
Purchase Details
Closed on
Oct 31, 2011
Sold by
Jones Edith Marilyn and Harris Marilyn
Bought by
Broadhead Robin
Home Financials for this Owner
Home Financials are based on the most recent Mortgage that was taken out on this home.
Original Mortgage
$119,897
Interest Rate
3.87%
Mortgage Type
New Conventional
Purchase Details
Closed on
Aug 3, 2005
Sold by
Harris Shawn
Bought by
Harris Shawn and Harris Marilyn
Home Financials for this Owner
Home Financials are based on the most recent Mortgage that was taken out on this home.
Original Mortgage
$24,600
Interest Rate
5.48%
Mortgage Type
Stand Alone Second
Create a Home Valuation Report for This Property
The Home Valuation Report is an in-depth analysis detailing your home's value as well as a comparison with similar homes in the area
Purchase History
| Date | Buyer | Sale Price | Title Company |
|---|---|---|---|
| Munson Tyson Lewis | -- | Northern Title Co | |
| Broadhead Robin | -- | -- | |
| Harris Shawn | -- | -- |
Source: Public Records
Mortgage History
| Date | Status | Borrower | Loan Amount |
|---|---|---|---|
| Open | Munson Tyson Lewis | $132,323 | |
| Previous Owner | Broadhead Robin | $119,897 | |
| Previous Owner | Harris Shawn | $24,600 | |
| Previous Owner | Harris Shawn | $104,800 |
Source: Public Records
Tax History
| Year | Tax Paid | Tax Assessment Tax Assessment Total Assessment is a certain percentage of the fair market value that is determined by local assessors to be the total taxable value of land and additions on the property. | Land | Improvement |
|---|---|---|---|---|
| 2025 | $1,387 | $315,404 | $60,000 | $255,404 |
| 2024 | $1,459 | $317,866 | $60,000 | $257,866 |
| 2023 | $1,361 | $317,866 | $60,000 | $257,866 |
| 2022 | $1,711 | $294,166 | $34,680 | $259,486 |
| 2021 | $1,539 | $267,572 | $34,680 | $232,892 |
| 2019 | $1,070 | $146,086 | $34,680 | $111,406 |
| 2018 | $1,075 | $139,006 | $27,600 | $111,406 |
| 2017 | $1,966 | $139,006 | $27,600 | $111,406 |
| 2016 | $583 | $142,340 | $27,600 | $114,740 |
| 2015 | $1,694 | $142,340 | $27,600 | $114,740 |
| 2014 | $20,446 | $139,710 | $27,600 | $112,110 |
| 2013 | $18,190 | $139,710 | $27,600 | $112,110 |
Source: Public Records
Map
Nearby Homes
- 209 E Main St
- 2307 E Maple Creek Rd Unit 4
- 210 S 125 E
- 3647 E Maple Creek Rd
- 4017 Little Mountain Cir
- 4008 Little Mountain Cir
- 483 S 30 E
- 36 W Legacy Dr
- 1400 E 4800 S Unit 1
- 5337 E Maple Creek Rd Unit 1
- 3201 Cherryville Ln Unit 3
- 4200 E Cub River Rd
- 2214 S 1600 E
- 2214 S 1600 E
- 50 E 800 N
- 3597 S Mountain Meadows Dr Unit 15
- 11 S Mountain Meadows Dr Unit 11
- 3436 Cub River Rd
- 780 N Main St
- 750 N Main St
Your Personal Tour Guide
Ask me questions while you tour the home.