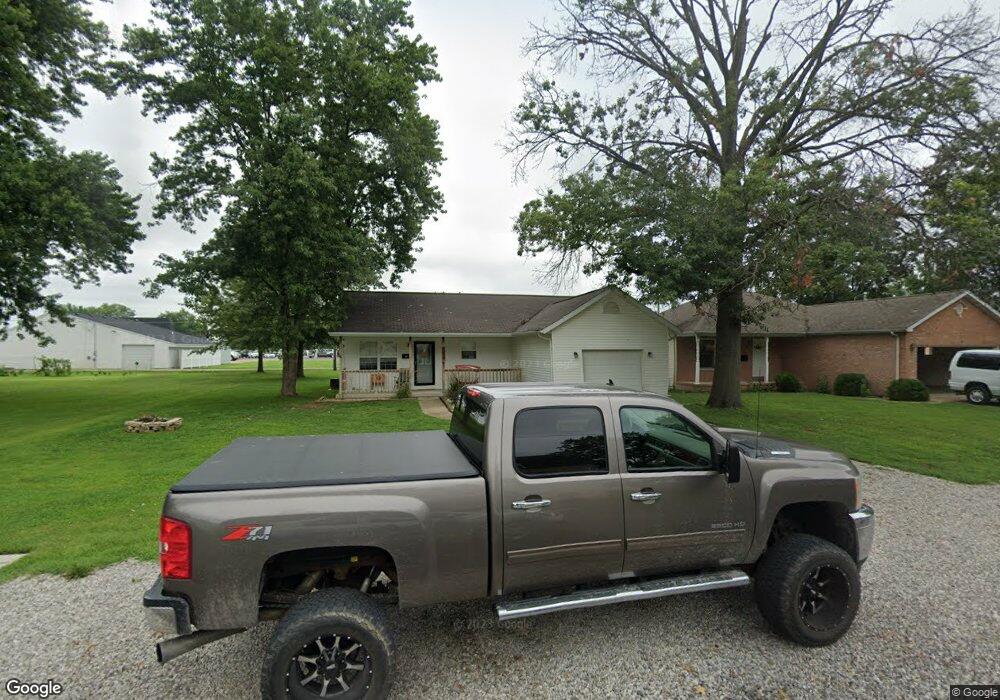
139 N 3rd St Breese, IL 62230
Estimated Value: $186,000 - $196,000
Studio
--
Bath
1,128
Sq Ft
$170/Sq Ft
Est. Value
About This Home
This home is located at 139 N 3rd St, Breese, IL 62230 and is currently estimated at $191,559, approximately $169 per square foot. 139 N 3rd St is a home located in Clinton County with nearby schools including Breese ESD #12, Beckemeyer Elementary School, and Central Community High School.
Ownership History
Date
Name
Owned For
Owner Type
Purchase Details
Closed on
Apr 25, 2019
Sold by
Albers Eugene B and Albers Esther E
Bought by
Dumstroff Erica N and Sheedy Brent
Current Estimated Value
Home Financials for this Owner
Home Financials are based on the most recent Mortgage that was taken out on this home.
Original Mortgage
$117,800
Outstanding Balance
$103,567
Interest Rate
4.3%
Mortgage Type
New Conventional
Estimated Equity
$87,992
Create a Home Valuation Report for This Property
The Home Valuation Report is an in-depth analysis detailing your home's value as well as a comparison with similar homes in the area
Home Values in the Area
Average Home Value in this Area
Purchase History
| Date | Buyer | Sale Price | Title Company |
|---|---|---|---|
| Dumstroff Erica N | $124,000 | None Available |
Source: Public Records
Mortgage History
| Date | Status | Borrower | Loan Amount |
|---|---|---|---|
| Open | Dumstroff Erica N | $117,800 |
Source: Public Records
Tax History
| Year | Tax Paid | Tax Assessment Tax Assessment Total Assessment is a certain percentage of the fair market value that is determined by local assessors to be the total taxable value of land and additions on the property. | Land | Improvement |
|---|---|---|---|---|
| 2024 | $3,420 | $55,600 | $6,840 | $48,760 |
| 2023 | $3,420 | $52,450 | $6,450 | $46,000 |
| 2022 | $3,378 | $47,680 | $5,860 | $41,820 |
| 2021 | $3,019 | $45,410 | $5,580 | $39,830 |
| 2020 | $2,951 | $43,670 | $5,370 | $38,300 |
| 2019 | $1,503 | $43,670 | $5,370 | $38,300 |
| 2018 | $1,545 | $42,338 | $5,262 | $37,076 |
| 2017 | $1,530 | $40,710 | $5,060 | $35,650 |
| 2016 | $1,556 | $40,710 | $5,060 | $35,650 |
| 2015 | $1,409 | $40,710 | $5,060 | $35,650 |
| 2013 | $1,409 | $43,110 | $5,060 | $38,050 |
Source: Public Records
Map
Nearby Homes
Your Personal Tour Guide
Ask me questions while you tour the home.