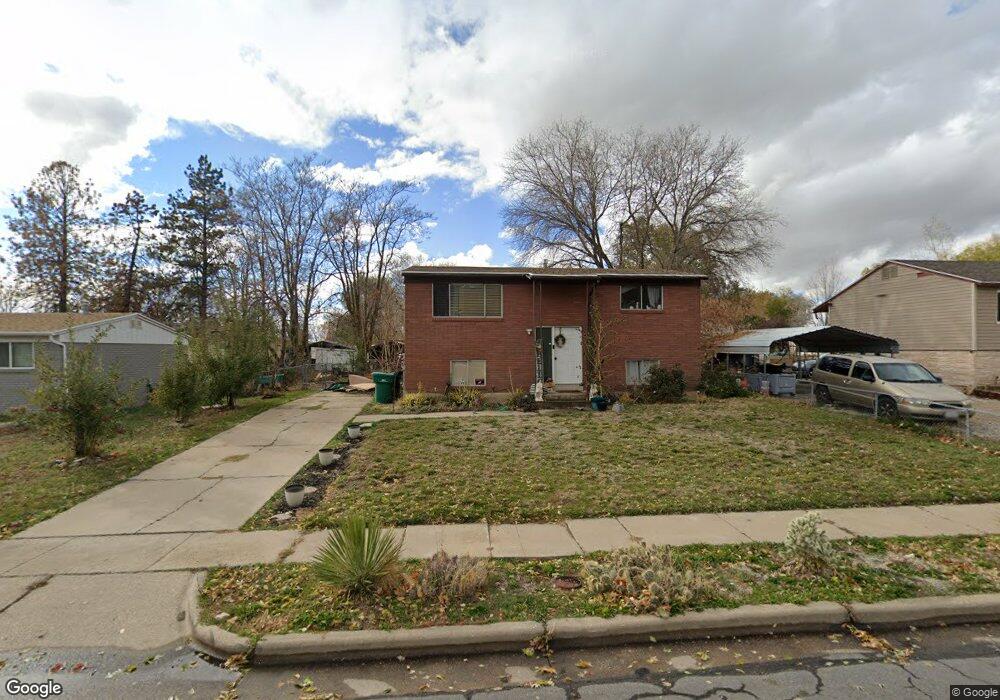
139 N 575 W Layton, UT 84041
Estimated Value: $381,000 - $423,120
3
Beds
2
Baths
1,632
Sq Ft
$247/Sq Ft
Est. Value
About This Home
This home is located at 139 N 575 W, Layton, UT 84041 and is currently estimated at $403,530, approximately $247 per square foot. 139 N 575 W is a home located in Davis County with nearby schools including Layton Elementary School, Fairfield Junior High School, and Layton High School.
Ownership History
Date
Name
Owned For
Owner Type
Purchase Details
Closed on
Jan 15, 2020
Sold by
Cunningfham Mckell
Bought by
Barlow Garrett R
Current Estimated Value
Home Financials for this Owner
Home Financials are based on the most recent Mortgage that was taken out on this home.
Original Mortgage
$239,900
Outstanding Balance
$211,920
Interest Rate
3.7%
Mortgage Type
VA
Estimated Equity
$191,610
Purchase Details
Closed on
Nov 1, 2017
Sold by
Herlin Michael and Herlin Celise
Bought by
Cunningham Mckell
Home Financials for this Owner
Home Financials are based on the most recent Mortgage that was taken out on this home.
Original Mortgage
$186,558
Interest Rate
4.37%
Mortgage Type
FHA
Purchase Details
Closed on
Jan 29, 2016
Sold by
Canyon Advantage Llc
Bought by
Herlin Michael and Herlin Celise
Purchase Details
Closed on
Jun 6, 2003
Sold by
Wilkinson Edward
Bought by
Wilkinson Edward L and Wilkinson Bonita
Home Financials for this Owner
Home Financials are based on the most recent Mortgage that was taken out on this home.
Original Mortgage
$35,000
Interest Rate
5.53%
Mortgage Type
Purchase Money Mortgage
Purchase Details
Closed on
Apr 20, 2002
Sold by
Wilkinson Kelly J
Bought by
Wilkinson Edward L and Wilkinson Bonita H
Create a Home Valuation Report for This Property
The Home Valuation Report is an in-depth analysis detailing your home's value as well as a comparison with similar homes in the area
Home Values in the Area
Average Home Value in this Area
Purchase History
| Date | Buyer | Sale Price | Title Company |
|---|---|---|---|
| Barlow Garrett R | -- | Backman Title Servic | |
| Cunningham Mckell | -- | -- | |
| Herlin Michael | -- | -- | |
| Wilkinson Edward L | -- | Backman Stewart Title Servic | |
| Wilkinson Edward | -- | Backman Stewart Title Servic | |
| Wilkinson Edward L | -- | -- |
Source: Public Records
Mortgage History
| Date | Status | Borrower | Loan Amount |
|---|---|---|---|
| Open | Barlow Garrett R | $239,900 | |
| Previous Owner | Cunningham Mckell | $186,558 | |
| Previous Owner | Wilkinson Edward | $35,000 |
Source: Public Records
Tax History Compared to Growth
Tax History
| Year | Tax Paid | Tax Assessment Tax Assessment Total Assessment is a certain percentage of the fair market value that is determined by local assessors to be the total taxable value of land and additions on the property. | Land | Improvement |
|---|---|---|---|---|
| 2025 | $1,834 | $192,500 | $107,584 | $84,916 |
| 2024 | $1,888 | $199,650 | $119,689 | $79,961 |
| 2023 | $1,840 | $343,000 | $117,073 | $225,927 |
| 2022 | $1,956 | $198,000 | $74,133 | $123,867 |
| 2021 | $1,848 | $279,000 | $111,232 | $167,768 |
| 2020 | $1,657 | $240,000 | $93,301 | $146,699 |
| 2019 | $1,537 | $218,000 | $96,582 | $121,418 |
| 2018 | $1,391 | $198,000 | $84,614 | $113,386 |
| 2016 | $1,070 | $78,595 | $32,811 | $45,784 |
| 2015 | $800 | $55,770 | $32,811 | $22,959 |
| 2014 | $689 | $49,139 | $32,811 | $16,328 |
| 2013 | -- | $61,129 | $17,588 | $43,541 |
Source: Public Records
Map
Nearby Homes
- 485 W 100 N
- 750 W Gentile St
- 65 Ronald Ave
- 356 W 25 N
- 355 W Gentile St
- 933 W Gentile St
- 6 Grover St
- 526 King St Unit 2
- 267 S Melody St
- 296 S 950 W
- 362 S 950 W
- 480 Spurlock St
- 142 Green Dr
- 441 Church St
- 562 S 850 W
- 1677 N 1600 W Unit 134
- 557 S Angel St
- Browning Plan at Amber Fields
- Rhapsody Plan at Amber Fields
- Accord Plan at Amber Fields