
Seller's Agent in 2025
Natanja Tabb-Peterson
@properties
(317) 345-2603
2 in this area
76 Total Sales
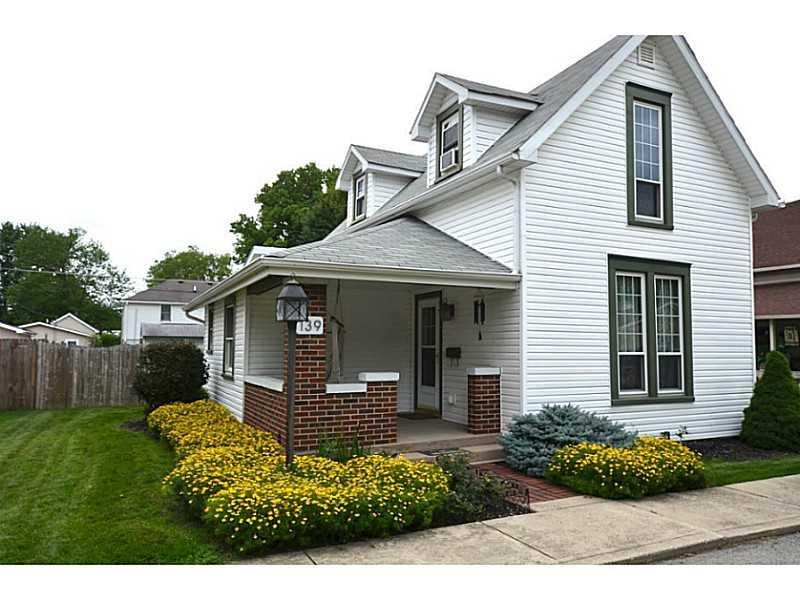
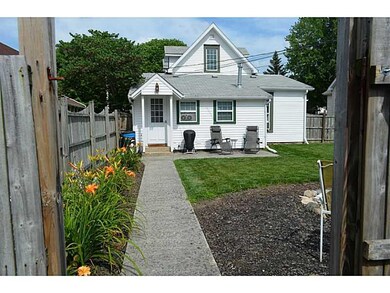
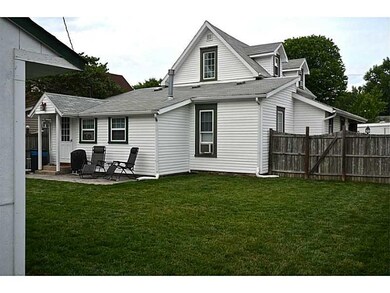
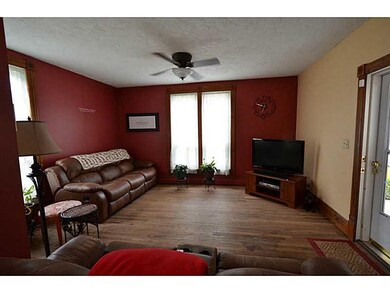

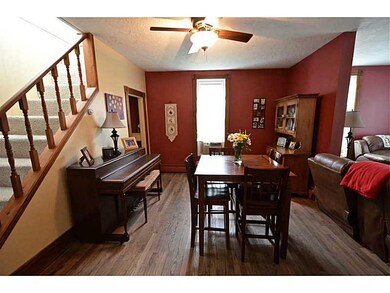
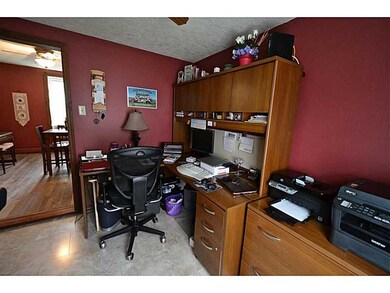
LOOKING FOR CHARM, AFFORDABILITY & MOVE-IN READY? THIS IS IT! AND IT'S IN DESIRABLE HISTORIC DISTRICT OF DOWNTOWN PENDLETON. WONDERFUL OLDER HOME W/LARGE OPEN LIVING ROOM, DINING ROOM W/ORIGINAL HRDWD FLOORS, LARGE NEWER WINDOWS & ORIGINIAL WOODWORK THROUGHOUT. 3 BEDROOMS, OFFICE/BONUS ROOM, UPDATED EAT-IN KITCHEN & SPACIOUS LAUNDRY/MUD ROOM. ENJOY EVENINGS ON COVERED FRONT PORCH OR RELAX OUT BACK IN LARGE FENCED YARD. WALKING DISTANCE TO PARK, SPORTS COMPLEX, POOL, LIBRARY, SHOPS & RESTAURANTS.
Last Agent to Sell the Property
Kathryn Edwards
Realty World Indy Listed on: 06/30/2015
Last Buyer's Agent
Heather Upton
Keller Williams Indy Metro NE
| Date | Type | Sale Price | Title Company |
|---|---|---|---|
| Warranty Deed | -- | Enterprise Title | |
| Warranty Deed | $228,000 | Lenders Escrow & Title | |
| Warranty Deed | -- | Lenders Escrow & Title | |
| Warranty Deed | -- | -- | |
| Warranty Deed | -- | -- |
| Date | Status | Loan Amount | Loan Type |
|---|---|---|---|
| Open | $237,500 | New Conventional | |
| Closed | $237,500 | New Conventional | |
| Previous Owner | $134,500 | New Conventional | |
| Previous Owner | $125,130 | New Conventional | |
| Previous Owner | $55,000 | New Conventional | |
| Previous Owner | $20,000 | New Conventional | |
| Previous Owner | $88,000 | New Conventional | |
| Previous Owner | $90,250 | New Conventional | |
| Previous Owner | $95,919 | FHA | |
| Previous Owner | $15,554 | Unknown |
| Date | Event | Price | Change | Sq Ft Price |
|---|---|---|---|---|
| 06/13/2025 06/13/25 | Sold | $250,000 | 0.0% | $135 / Sq Ft |
| 05/04/2025 05/04/25 | Pending | -- | -- | -- |
| 05/02/2025 05/02/25 | For Sale | $250,000 | +9.6% | $135 / Sq Ft |
| 08/29/2023 08/29/23 | Sold | $228,000 | +3.7% | $150 / Sq Ft |
| 07/28/2023 07/28/23 | Pending | -- | -- | -- |
| 07/25/2023 07/25/23 | Price Changed | $219,900 | 0.0% | $145 / Sq Ft |
| 07/25/2023 07/25/23 | For Sale | $219,900 | -3.6% | $145 / Sq Ft |
| 07/24/2023 07/24/23 | Off Market | $228,000 | -- | -- |
| 07/18/2023 07/18/23 | Price Changed | $234,000 | -6.4% | $154 / Sq Ft |
| 07/08/2023 07/08/23 | Price Changed | $249,900 | -3.8% | $165 / Sq Ft |
| 06/21/2023 06/21/23 | For Sale | $259,900 | +136.3% | $171 / Sq Ft |
| 09/23/2016 09/23/16 | Sold | $110,000 | 0.0% | $72 / Sq Ft |
| 08/08/2016 08/08/16 | Off Market | $110,000 | -- | -- |
| 07/26/2016 07/26/16 | For Sale | $114,900 | +17.2% | $76 / Sq Ft |
| 07/24/2015 07/24/15 | Sold | $98,000 | -1.9% | $65 / Sq Ft |
| 07/07/2015 07/07/15 | Pending | -- | -- | -- |
| 06/30/2015 06/30/15 | For Sale | $99,900 | -- | $66 / Sq Ft |
| Year | Tax Paid | Tax Assessment Tax Assessment Total Assessment is a certain percentage of the fair market value that is determined by local assessors to be the total taxable value of land and additions on the property. | Land | Improvement |
|---|---|---|---|---|
| 2024 | $1,428 | $149,100 | $21,100 | $128,000 |
| 2023 | $1,379 | $136,600 | $20,100 | $116,500 |
| 2022 | $2,707 | $135,200 | $19,200 | $116,000 |
| 2021 | $2,521 | $125,900 | $19,200 | $106,700 |
| 2020 | $2,577 | $122,600 | $18,200 | $104,400 |
| 2019 | $1,234 | $122,100 | $18,200 | $103,900 |
| 2018 | $1,026 | $107,000 | $18,300 | $88,700 |
| 2017 | $908 | $98,200 | $16,900 | $81,300 |
| 2016 | $954 | $100,500 | $16,900 | $83,600 |
| 2014 | $944 | $99,400 | $16,900 | $82,500 |
| 2013 | $944 | $99,400 | $16,900 | $82,500 |
Seller's Agent in 2025
Natanja Tabb-Peterson
@properties
(317) 345-2603
2 in this area
76 Total Sales
Buyer's Agent in 2025
Jen Webster
F.C. Tucker Company
(317) 691-5366
1 in this area
143 Total Sales
Seller's Agent in 2023
Sarah Hubley
Mike Thomas Associates
(260) 242-1543
3 in this area
148 Total Sales
P
Seller's Agent in 2016
Patricia Travis
K
Seller's Agent in 2015
Kathryn Edwards
Realty World Indy
H
Buyer's Agent in 2015
Heather Upton
Keller Williams Indy Metro NE
Source: MIBOR Broker Listing Cooperative®
MLS Number: MBR21362595
APN: 48-14-21-201-110.000-013
Disclaimer: Certain information contained herein is derived from information provided by parties other than Homes.com. All information provided is deemed reliable, but is not guaranteed to be accurate and should be independently verified.
![]() Based on information submitted to the MLS GRID. All data is obtained from various sources and may not have been verified by broker or MLS GRID. Supplied Open House Information is subject to change without notice. All information should be independently reviewed and verified for accuracy. Properties may or may not be listed by the office/agent presenting the information. Some IDX listings have been excluded from this website.
Based on information submitted to the MLS GRID. All data is obtained from various sources and may not have been verified by broker or MLS GRID. Supplied Open House Information is subject to change without notice. All information should be independently reviewed and verified for accuracy. Properties may or may not be listed by the office/agent presenting the information. Some IDX listings have been excluded from this website.