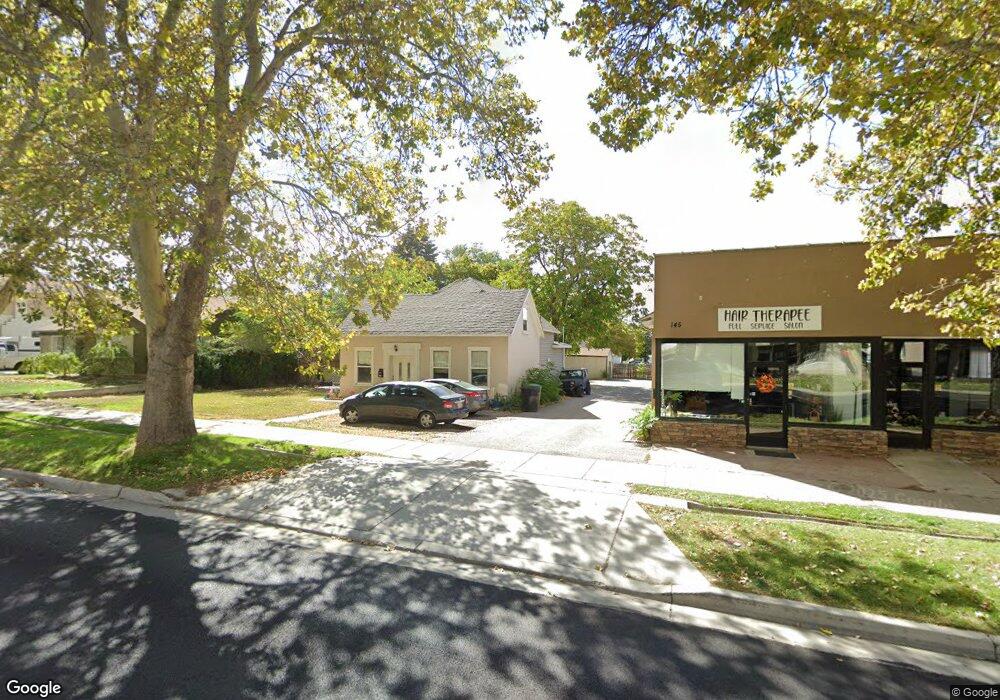
139 N Main St Brigham City, UT 84302
Estimated Value: $344,778 - $447,000
3
Beds
1
Bath
1,732
Sq Ft
$221/Sq Ft
Est. Value
About This Home
This home is located at 139 N Main St, Brigham City, UT 84302 and is currently estimated at $382,195, approximately $220 per square foot. 139 N Main St is a home located in Box Elder County with nearby schools including Discovery School, Box Elder Middle School, and Adele C. Young Intermediate School.
Ownership History
Date
Name
Owned For
Owner Type
Purchase Details
Closed on
Jun 1, 2016
Sold by
Simcox Robert S and Simcox Linda A
Bought by
Simcox Rentals Llc
Current Estimated Value
Purchase Details
Closed on
Mar 7, 2011
Sold by
Federal Home Loan Mortgag Corp
Bought by
Simox Robert S
Purchase Details
Closed on
Jun 11, 2010
Sold by
Torres Benny and Torres Lillian Virginia
Bought by
Federal Home Loan Mortgage Corporation
Purchase Details
Closed on
Nov 15, 2007
Sold by
Straup M Fred
Bought by
Torres Benny and Torres Lillian Virginia
Home Financials for this Owner
Home Financials are based on the most recent Mortgage that was taken out on this home.
Original Mortgage
$128,000
Interest Rate
6.36%
Mortgage Type
New Conventional
Create a Home Valuation Report for This Property
The Home Valuation Report is an in-depth analysis detailing your home's value as well as a comparison with similar homes in the area
Home Values in the Area
Average Home Value in this Area
Purchase History
| Date | Buyer | Sale Price | Title Company |
|---|---|---|---|
| Simcox Rentals Llc | -- | None Available | |
| Simox Robert S | -- | None Available | |
| Federal Home Loan Mortgage Corporation | $115,500 | -- | |
| Torres Benny | -- | First American Title Ins Co |
Source: Public Records
Mortgage History
| Date | Status | Borrower | Loan Amount |
|---|---|---|---|
| Previous Owner | Torres Benny | $128,000 |
Source: Public Records
Tax History Compared to Growth
Tax History
| Year | Tax Paid | Tax Assessment Tax Assessment Total Assessment is a certain percentage of the fair market value that is determined by local assessors to be the total taxable value of land and additions on the property. | Land | Improvement |
|---|---|---|---|---|
| 2025 | $1,663 | $324,460 | $105,000 | $219,460 |
| 2024 | $1,663 | $320,166 | $100,000 | $220,166 |
| 2023 | $1,720 | $339,117 | $95,000 | $244,117 |
| 2022 | $1,371 | $251,237 | $40,000 | $211,237 |
| 2021 | $1,213 | $174,901 | $40,000 | $134,901 |
| 2020 | $1,077 | $174,901 | $40,000 | $134,901 |
| 2019 | $1,014 | $87,660 | $22,000 | $65,660 |
| 2018 | $920 | $79,096 | $22,000 | $57,096 |
| 2017 | $685 | $101,928 | $16,500 | $71,928 |
| 2016 | $720 | $54,177 | $16,500 | $37,677 |
| 2015 | $678 | $50,752 | $16,500 | $34,252 |
| 2014 | $678 | $49,121 | $16,500 | $32,621 |
| 2013 | -- | $49,121 | $16,500 | $32,621 |
Source: Public Records
Map
Nearby Homes