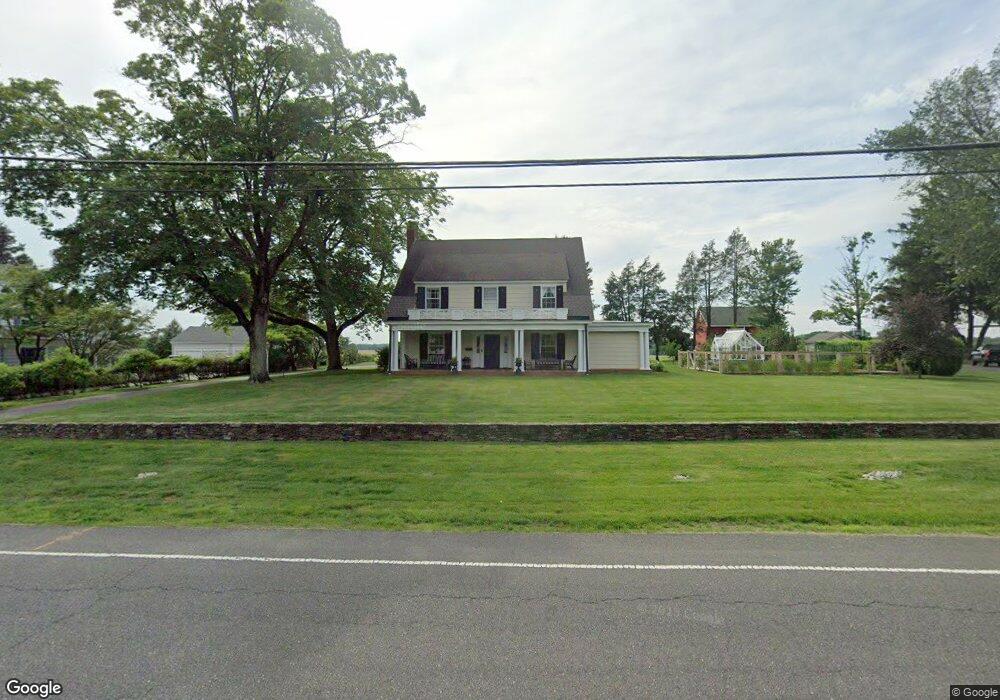
139 N Main St Cranbury, NJ 08512
Estimated Value: $920,510 - $1,149,000
--
Bed
--
Bath
2,364
Sq Ft
$417/Sq Ft
Est. Value
About This Home
This home is located at 139 N Main St, Cranbury, NJ 08512 and is currently estimated at $985,878, approximately $417 per square foot. 139 N Main St is a home located in Middlesex County with nearby schools including The Cranbury School, E Windsor Knowledge Beginnings, and SciCore Academy.
Ownership History
Date
Name
Owned For
Owner Type
Purchase Details
Closed on
Feb 11, 2002
Sold by
Sebastianelli Joseph
Bought by
Till James and Till Michele
Current Estimated Value
Home Financials for this Owner
Home Financials are based on the most recent Mortgage that was taken out on this home.
Original Mortgage
$400,000
Outstanding Balance
$165,162
Interest Rate
7.04%
Estimated Equity
$820,716
Purchase Details
Closed on
Aug 9, 2000
Sold by
Hagen Andrea
Bought by
Sebastianelli Joseph and Sebastianelli Leanne
Create a Home Valuation Report for This Property
The Home Valuation Report is an in-depth analysis detailing your home's value as well as a comparison with similar homes in the area
Home Values in the Area
Average Home Value in this Area
Purchase History
| Date | Buyer | Sale Price | Title Company |
|---|---|---|---|
| Till James | $600,000 | -- | |
| Sebastianelli Joseph | $562,500 | -- |
Source: Public Records
Mortgage History
| Date | Status | Borrower | Loan Amount |
|---|---|---|---|
| Open | Till James | $400,000 |
Source: Public Records
Tax History Compared to Growth
Tax History
| Year | Tax Paid | Tax Assessment Tax Assessment Total Assessment is a certain percentage of the fair market value that is determined by local assessors to be the total taxable value of land and additions on the property. | Land | Improvement |
|---|---|---|---|---|
| 2025 | $11,914 | $649,600 | $249,400 | $400,200 |
| 2024 | $11,745 | $649,600 | $249,400 | $400,200 |
| 2023 | $11,745 | $649,600 | $249,400 | $400,200 |
| 2022 | $11,576 | $649,600 | $249,400 | $400,200 |
| 2021 | $8,701 | $649,600 | $249,400 | $400,200 |
| 2020 | $11,563 | $649,600 | $249,400 | $400,200 |
| 2019 | $11,686 | $649,600 | $249,400 | $400,200 |
| 2018 | $12,791 | $649,600 | $249,400 | $400,200 |
| 2017 | $12,453 | $649,600 | $249,400 | $400,200 |
| 2016 | $12,557 | $649,600 | $249,400 | $400,200 |
| 2015 | $12,329 | $649,600 | $249,400 | $400,200 |
| 2014 | $12,375 | $649,600 | $249,400 | $400,200 |
Source: Public Records
Map
Nearby Homes
- 2657 Route 130
- 6 Ryan Rd
- 0-0 Route 130
- 75 N Main St
- 0 Dey Rd
- 150 Dey Rd
- 15 Griffin Ln
- 17 Griffin Ln
- 7 Arthur Ln
- 5 Arthur Ln
- 3 Arthur Ln
- 5 Trowbridge Ln
- 119 Broadway Rd Unit 127
- 30 Merlot Ct
- 95 Halsey Reed Rd
- 11 Sonoma St
- 14 Hightstown Cranbury Station Rd
- 17 Landmark Rd
- 458 Revere Way Unit A
- 456 Roxbury Ln Unit O