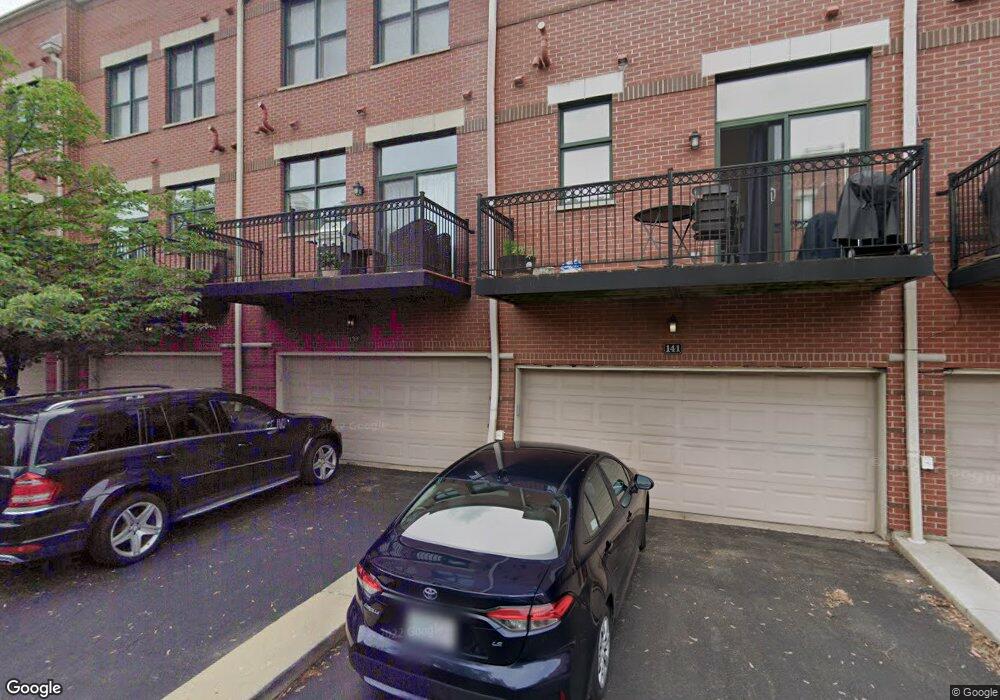
139 N Maple St Unit 8 Palatine, IL 60067
Downtown Palatine NeighborhoodEstimated Value: $407,000 - $503,000
3
Beds
3
Baths
2,000
Sq Ft
$226/Sq Ft
Est. Value
About This Home
This home is located at 139 N Maple St Unit 8, Palatine, IL 60067 and is currently estimated at $452,133, approximately $226 per square foot. 139 N Maple St Unit 8 is a home located in Cook County with nearby schools including Stuart R Paddock School, Plum Grove Jr High School, and William Fremd High School.
Ownership History
Date
Name
Owned For
Owner Type
Purchase Details
Closed on
Nov 15, 2019
Sold by
Probst Patricia
Bought by
Probst Patricia and Probst Collin M
Current Estimated Value
Purchase Details
Closed on
Mar 12, 2012
Sold by
Matheou Andreas R and Matheou Rebecca
Bought by
Probst Patricia
Home Financials for this Owner
Home Financials are based on the most recent Mortgage that was taken out on this home.
Original Mortgage
$130,000
Outstanding Balance
$13,035
Interest Rate
3.88%
Mortgage Type
New Conventional
Estimated Equity
$439,098
Purchase Details
Closed on
Oct 24, 2005
Sold by
Searles Ralph D and Searles Diane F
Bought by
Matheou Andreas R
Home Financials for this Owner
Home Financials are based on the most recent Mortgage that was taken out on this home.
Original Mortgage
$345,600
Interest Rate
5.5%
Mortgage Type
Unknown
Purchase Details
Closed on
Apr 21, 2005
Sold by
Toll Il Iii Lp
Bought by
Searles Ralph D and Searles Diane F
Create a Home Valuation Report for This Property
The Home Valuation Report is an in-depth analysis detailing your home's value as well as a comparison with similar homes in the area
Home Values in the Area
Average Home Value in this Area
Purchase History
| Date | Buyer | Sale Price | Title Company |
|---|---|---|---|
| Probst Patricia | -- | None Available | |
| Probst Patricia | $315,000 | Fatic | |
| Matheou Andreas R | $432,000 | Lawyers Title Insurance Corp | |
| Searles Ralph D | $384,500 | 1St American Title |
Source: Public Records
Mortgage History
| Date | Status | Borrower | Loan Amount |
|---|---|---|---|
| Open | Probst Patricia | $130,000 | |
| Previous Owner | Matheou Andreas R | $345,600 |
Source: Public Records
Tax History
| Year | Tax Paid | Tax Assessment Tax Assessment Total Assessment is a certain percentage of the fair market value that is determined by local assessors to be the total taxable value of land and additions on the property. | Land | Improvement |
|---|---|---|---|---|
| 2025 | -- | $41,271 | $1,838 | $39,433 |
| 2024 | -- | $35,326 | $1,575 | $33,751 |
| 2023 | -- | $35,326 | $1,575 | $33,751 |
| 2022 | $0 | $35,326 | $1,575 | $33,751 |
| 2021 | $8,109 | $32,150 | $918 | $31,232 |
| 2020 | $8,109 | $32,150 | $918 | $31,232 |
| 2019 | $9,277 | $35,777 | $918 | $34,859 |
| 2018 | $8,109 | $29,529 | $853 | $28,676 |
| 2017 | $7,974 | $29,529 | $853 | $28,676 |
| 2016 | $7,665 | $29,529 | $853 | $28,676 |
| 2015 | $7,151 | $25,896 | $787 | $25,109 |
| 2014 | $7,080 | $25,896 | $787 | $25,109 |
| 2013 | $7,659 | $25,896 | $787 | $25,109 |
Source: Public Records
Map
Nearby Homes
- 435 W Wood St Unit 205A
- 410 W Mahogany Ct Unit 305
- 410 W Mahogany Ct Unit 509
- 440 W Mahogany Ct Unit 608
- 235 N Smith St Unit 412
- 315 Johnson St
- 104 N Plum Grove Rd Unit 400
- 228 W Fairview Way
- 3 E Slade St
- 145 S Hickory St
- 77 N Quentin Rd Unit 305
- 709 W Glencoe Rd
- 457 N Comfort Ln
- 122 W Helen Rd
- 659 N Walden Dr
- 886 W Palatine Rd
- 385 N Chalary Ct
- 142 S Fremont St
- 316 N Schiller St
- 113 W Brandon Ct Unit E31
- 141 N Maple St Unit 9
- 137 N Maple St
- 137 N Maple St Unit 7
- 135 N Maple St Unit 6
- 145 N Maple St Unit 11
- 143 N Maple St Unit 10
- 143 N Maple St Unit 143
- 133 N Maple St Unit 5
- 147 N Maple St Unit 12
- 149 N Maple St Unit 13
- 131 N Maple St Unit 4
- 129 N Maple St Unit 3
- 127 N Maple St Unit 2
- 151 N Maple St Unit 14
- 325 W Wood St Unit 15
- 144 N Rose St Unit 34
- 321 W Wood St Unit 17
- 323 W Wood St Unit 16
- 146 N Rose St Unit 33
- 148 N Rose St Unit 31
Your Personal Tour Guide
Ask me questions while you tour the home.