Estimated Value: $133,000 - $176,230
3
Beds
1
Bath
1,432
Sq Ft
$102/Sq Ft
Est. Value
About This Home
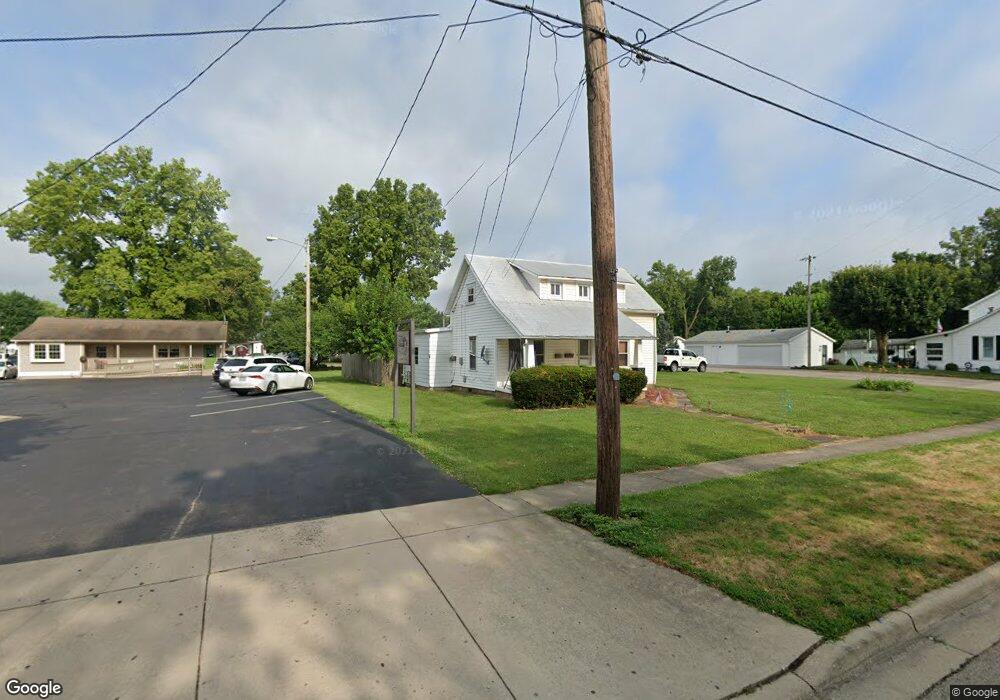
This home is located at 139 N Xenia Dr, Enon, OH 45323 and is currently estimated at $145,558, approximately $101 per square foot. 139 N Xenia Dr is a home located in Clark County with nearby schools including Greenon Elementary School, Greenon Jr. High School, and Greenon High School.
Ownership History
Date
Name
Owned For
Owner Type
Purchase Details
Closed on
Apr 24, 2025
Sold by
Kab Homes Llc
Bought by
Byrum Wyatt A
Current Estimated Value
Home Financials for this Owner
Home Financials are based on the most recent Mortgage that was taken out on this home.
Original Mortgage
$109,150
Outstanding Balance
$108,666
Interest Rate
6.65%
Mortgage Type
New Conventional
Estimated Equity
$36,893
Purchase Details
Closed on
Feb 12, 2021
Sold by
Jones Richard W and Jones Dawn M
Bought by
Kab Homes Llc
Purchase Details
Closed on
Mar 19, 2007
Sold by
Enon Mobile Home Park Llc
Bought by
Jones Richard W and Jones Dawn M
Home Financials for this Owner
Home Financials are based on the most recent Mortgage that was taken out on this home.
Original Mortgage
$66,000
Interest Rate
6.27%
Mortgage Type
Purchase Money Mortgage
Create a Home Valuation Report for This Property
The Home Valuation Report is an in-depth analysis detailing your home's value as well as a comparison with similar homes in the area
Home Values in the Area
Average Home Value in this Area
Purchase History
| Date | Buyer | Sale Price | Title Company |
|---|---|---|---|
| Byrum Wyatt A | $130,000 | None Listed On Document | |
| Kab Homes Llc | $65,000 | Team Title & Closing Services | |
| Kab Homes Llc | $65,000 | Team Title & Closing Services | |
| Jones Richard W | $70,000 | Ohio Real Estate Title |
Source: Public Records
Mortgage History
| Date | Status | Borrower | Loan Amount |
|---|---|---|---|
| Open | Byrum Wyatt A | $109,150 | |
| Previous Owner | Jones Richard W | $66,000 |
Source: Public Records
Tax History Compared to Growth
Tax History
| Year | Tax Paid | Tax Assessment Tax Assessment Total Assessment is a certain percentage of the fair market value that is determined by local assessors to be the total taxable value of land and additions on the property. | Land | Improvement |
|---|---|---|---|---|
| 2024 | $3,000 | $32,970 | $10,330 | $22,640 |
| 2023 | $3,000 | $32,970 | $10,330 | $22,640 |
| 2022 | $1,934 | $32,970 | $10,330 | $22,640 |
| 2021 | $1,744 | $26,810 | $8,400 | $18,410 |
| 2020 | $1,748 | $26,810 | $8,400 | $18,410 |
| 2019 | $1,769 | $26,810 | $8,400 | $18,410 |
| 2018 | $1,600 | $23,530 | $8,400 | $15,130 |
| 2017 | $1,604 | $23,534 | $8,400 | $15,134 |
| 2016 | $1,378 | $23,534 | $8,400 | $15,134 |
| 2015 | $1,386 | $22,950 | $8,400 | $14,550 |
| 2014 | $1,388 | $22,950 | $8,400 | $14,550 |
| 2013 | $1,274 | $22,950 | $8,400 | $14,550 |
Source: Public Records
Map
Nearby Homes
- 32 Helmer Cir
- 3915 Sparkhill Dr
- 6835 Joseph Dr
- 3956 Sparkhill Dr
- 68 Skyline Dr
- 6891 Joseph Dr
- 5822 Broadway Rd
- 4312 Tamara St
- 5540 Broadway Rd
- 4441 S Xenia Dr
- 4538 Cynthia Dr
- 3072 Fowler Rd
- 6729 Sterling Dr
- 5177 Outerview Dr
- 2600 Brookdale Dr
- 7581 Dayton Springfield Rd
- 25 Sunnybrook Trail
- 7035 Creekside Cir
- 5820 Wynn Rd
- 806 Spring Lake Cir Unit 6